
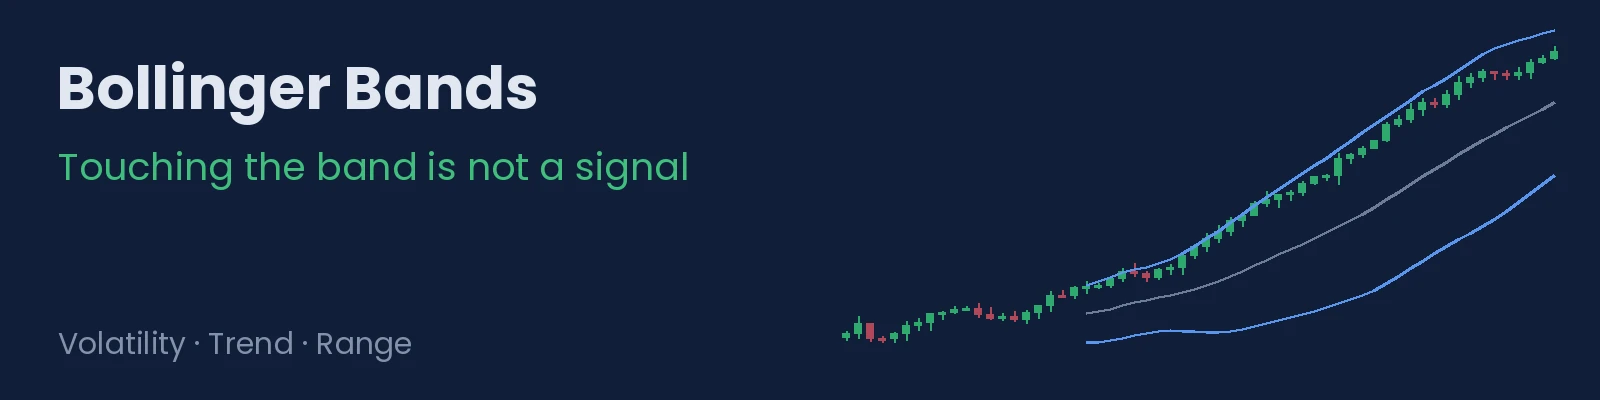
Bollinger Bands: Touching the Band Is Not a Signal
What Bollinger Bands measure, why the price can ride the upper band for a whole trend, when touches make sense in a range and how they differ from ATR.

Risk, stops, volatility and costs. Informative articles, no filler.
What Bollinger Bands measure, why the price can ride the upper band for a whole trend, when touches make sense in a range and how they differ from ATR.
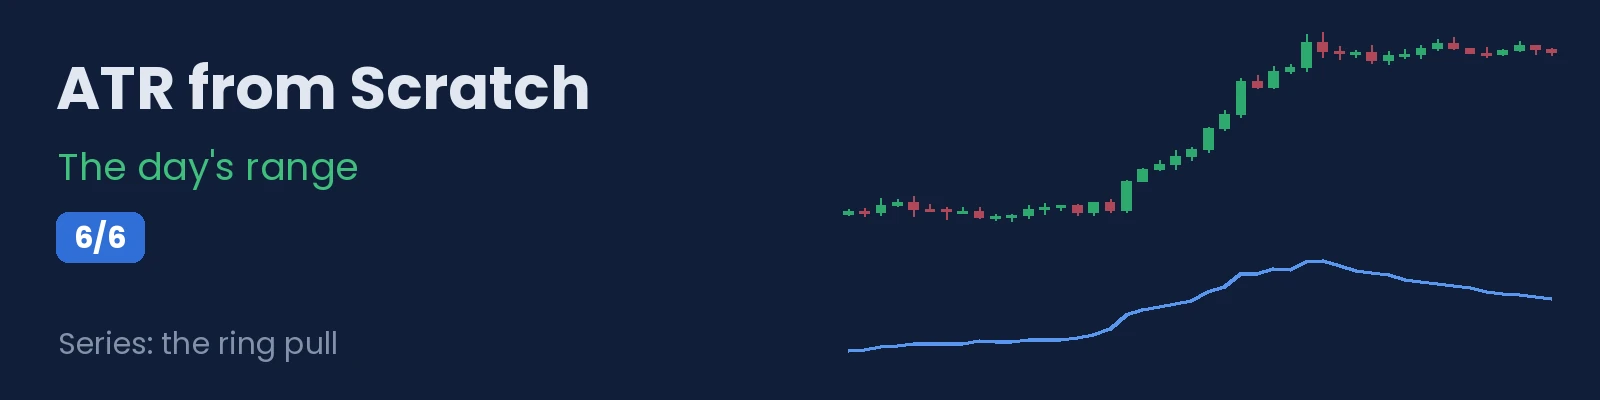
Last episode of the ATR series: how to measure how much of its usual range the session has already covered, what that means for entries and targets, and a summary of everything we have seen.
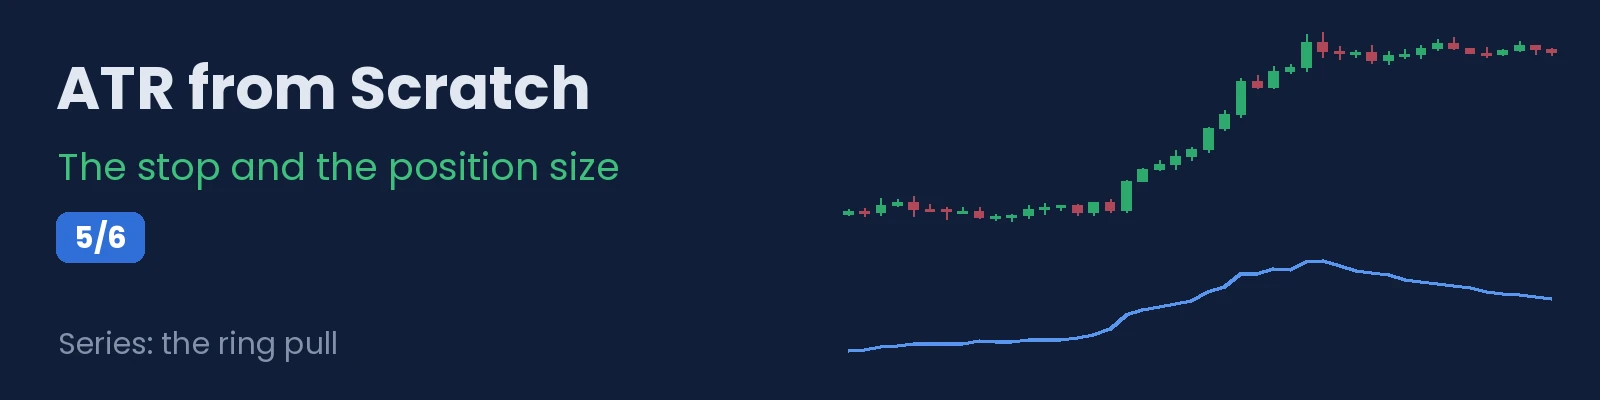
Fifth episode of the ATR series: how much room the stop needs depending on volatility, how to calculate the lot size to always risk the same amount and what to do when ATR changes.
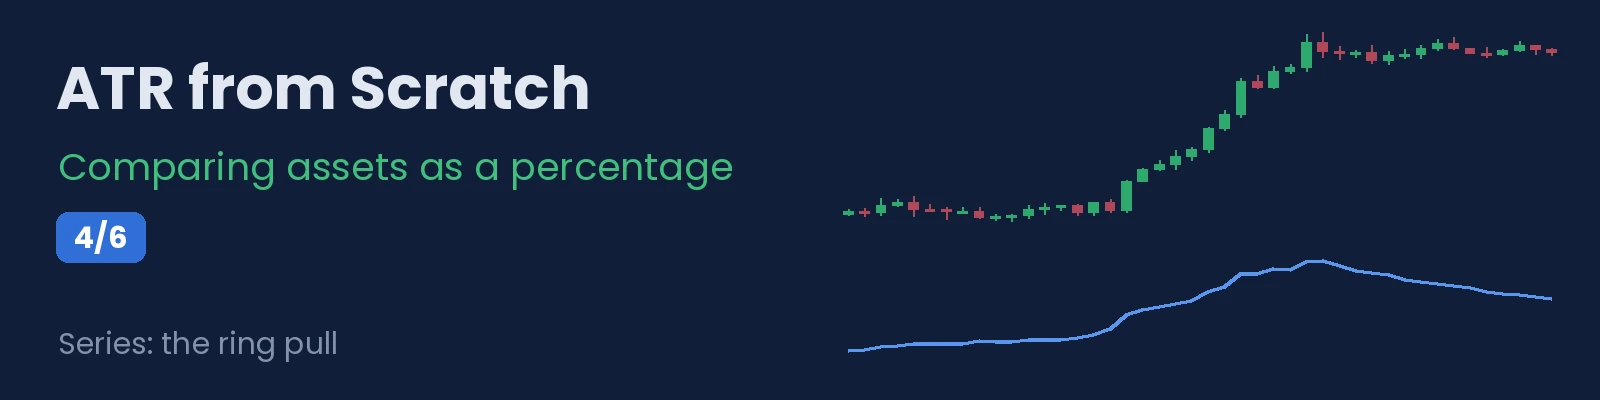
Fourth episode of the ATR series: why you cannot compare an index's ATR with a currency pair's in points, how to convert it to a percentage of the price and what that comparison is for.
Third episode of the ATR series: why a single value says nothing, how to tell whether current volatility is high, normal or low for that asset and what changes in your trades in each case.
Second episode of the ATR series: what the true range is and why it includes gaps, how it is averaged, what changes with the timeframe and why 14 periods is not a rule.
First episode of the ATR series: what it is, what it measures and what it does not, how to read its value and why it sits behind almost every risk decision.

Why watching the chart non-stop makes decisions worse, how many "opportunities" each timeframe creates, how to let MT5 watch for you and a few simple rules for knowing when to close the laptop.
How to practise a discretionary strategy candle by candle on past data, how many trades you need before drawing conclusions, the limits of practice and how to do it with the MetaTrader strategy tester.
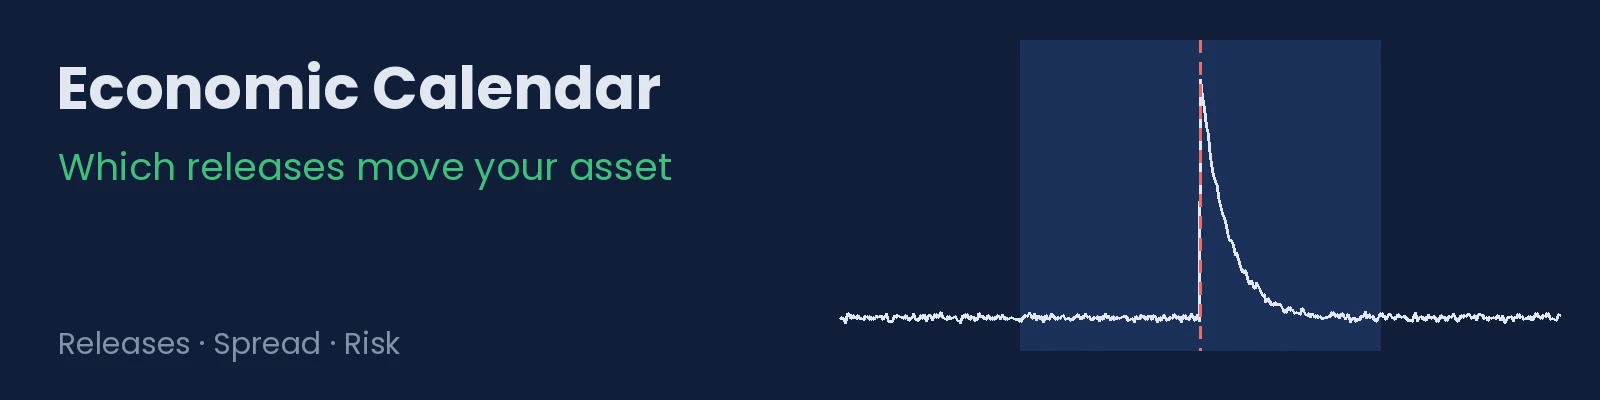
How to read an economic calendar, which releases usually move indices, currencies and gold, why the surprise matters more than the figure, what happens to the spread and what to do with open positions.
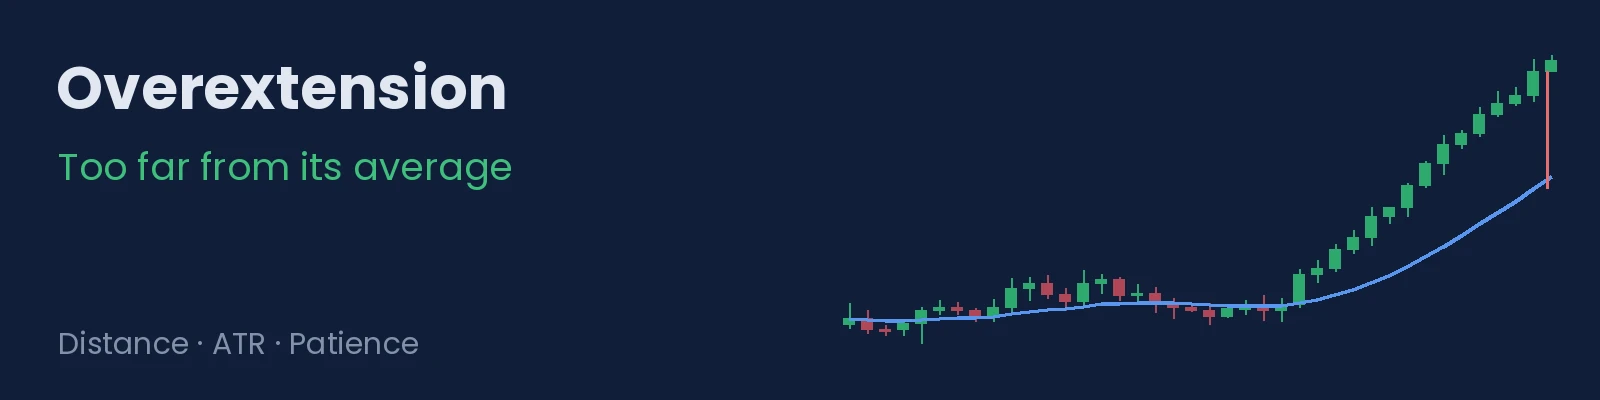
How to measure the distance between price and its average in multiples of ATR, why a very extended trend often pauses or pulls back, why that is not a sell signal and how to use it to avoid chasing the price.
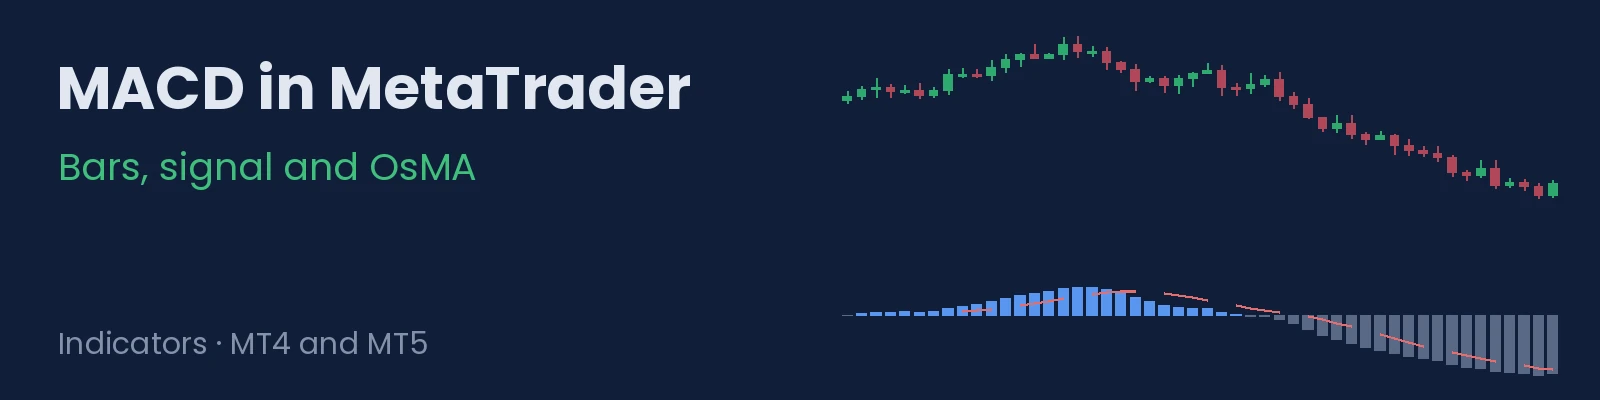
What MACD calculates, why MetaTrader (MT4 and MT5) draws the main line as a histogram, how to see the classic histogram with OsMA and which reading makes sense without turning it into a signal machine.
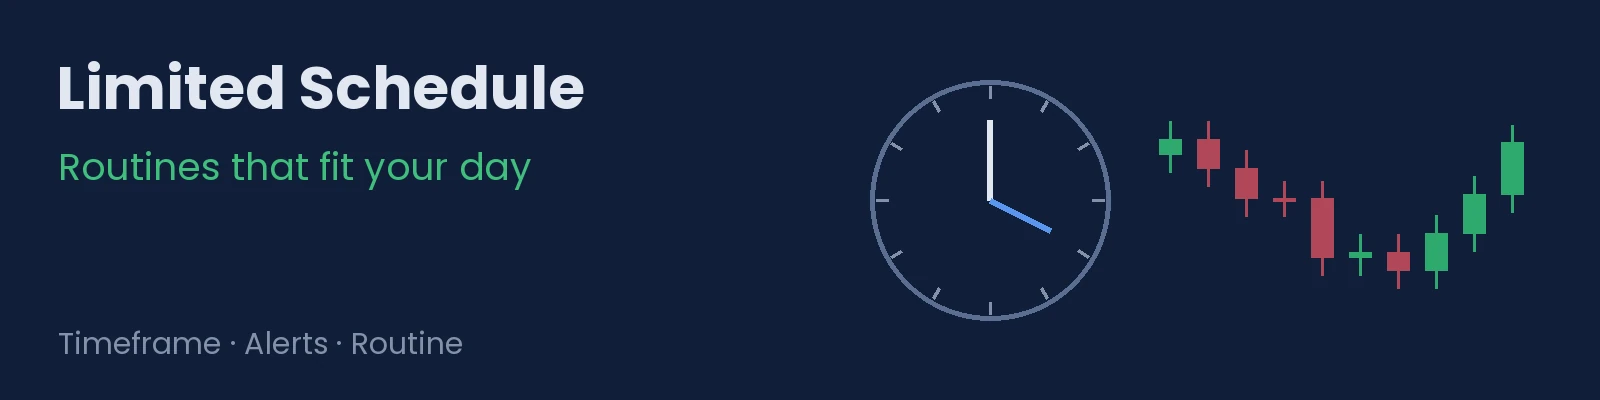
How to choose the timeframe based on the time you have, what changes in the stop and the lot size, how to use pending orders and alerts in MT5 and an example of a weekly routine that fits around a job.
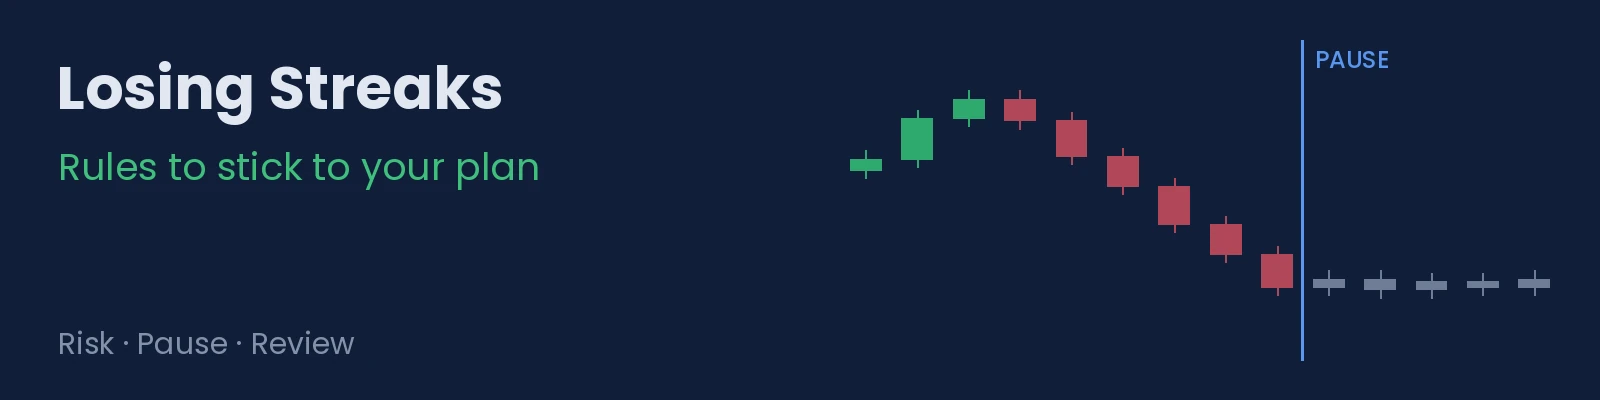
The most common mistakes during a losing streak, how to set pause rules before one arrives and a short review to tell a normal streak from an execution problem.
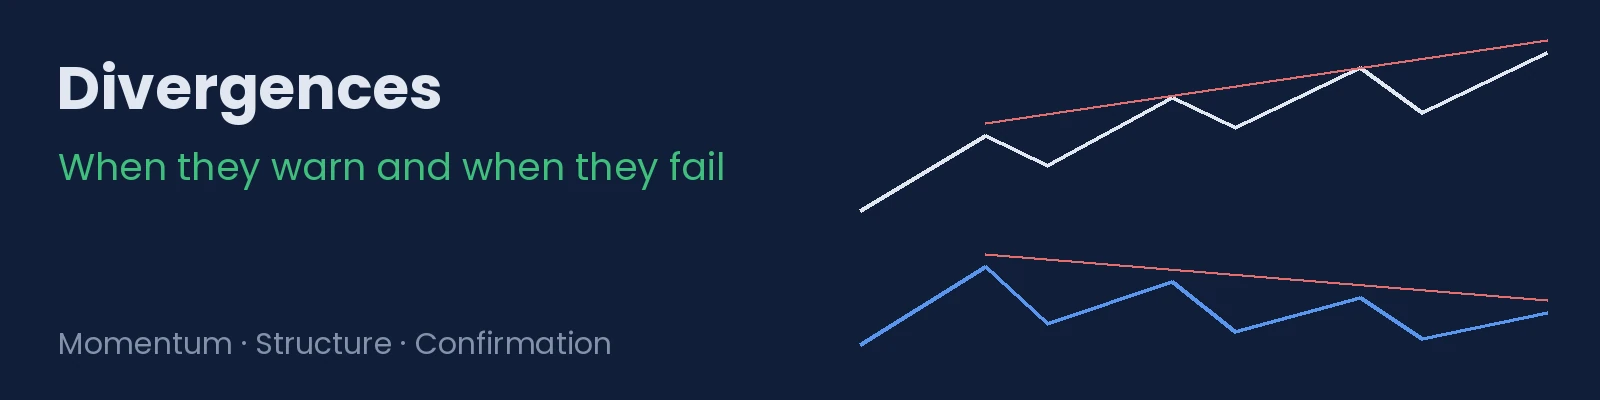
What a divergence between price and an oscillator is, why a trend can produce several before turning, how to confirm it with structure and how to mark divergences the same way every time in MT5.
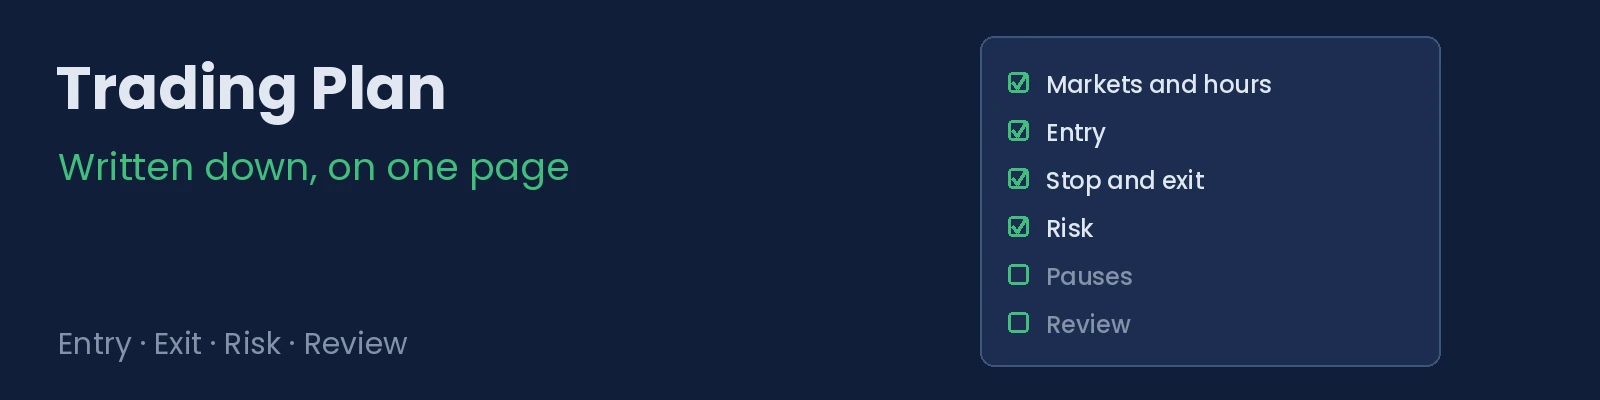
Which sections a trading plan for manual trading should have, how to write rules you can actually follow and an example of a one-page plan for MT5.
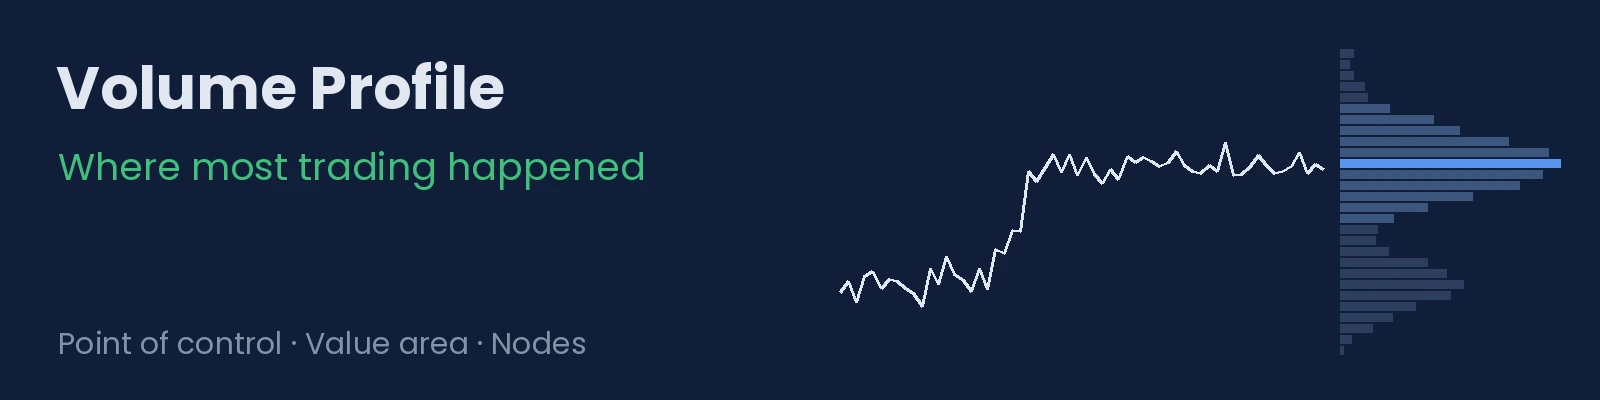
What a volume profile is, what the point of control, the value area and high- and low-volume nodes indicate, the limits of CFD tick volume and how to use it in MT5.
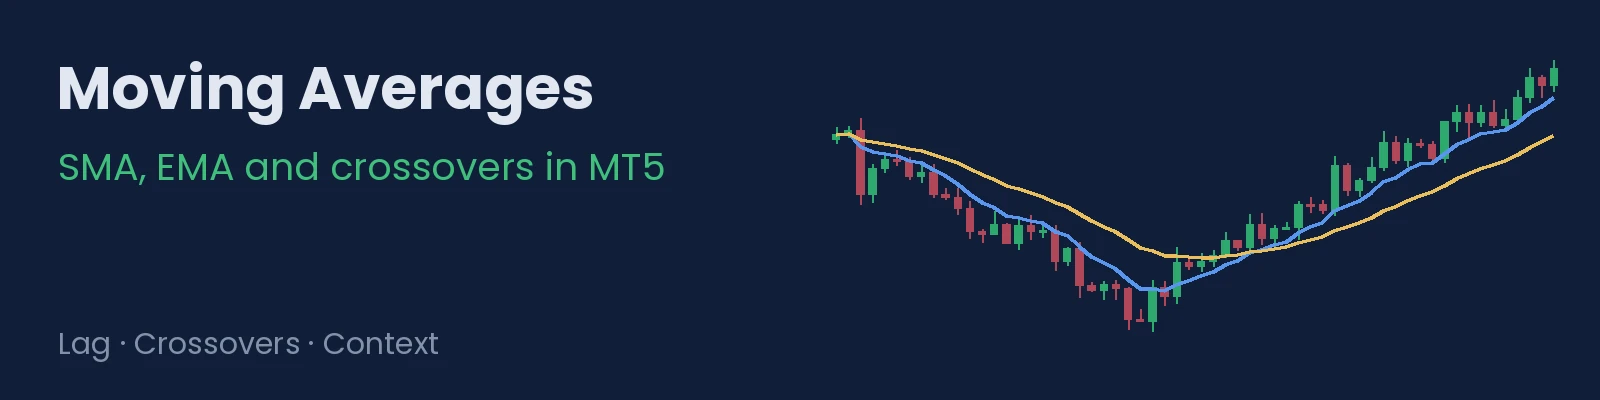
What each MT5 moving average calculates, how much lag it has depending on its period, why a crossover confirms but does not anticipate, and how to use averages without depending on their signals.
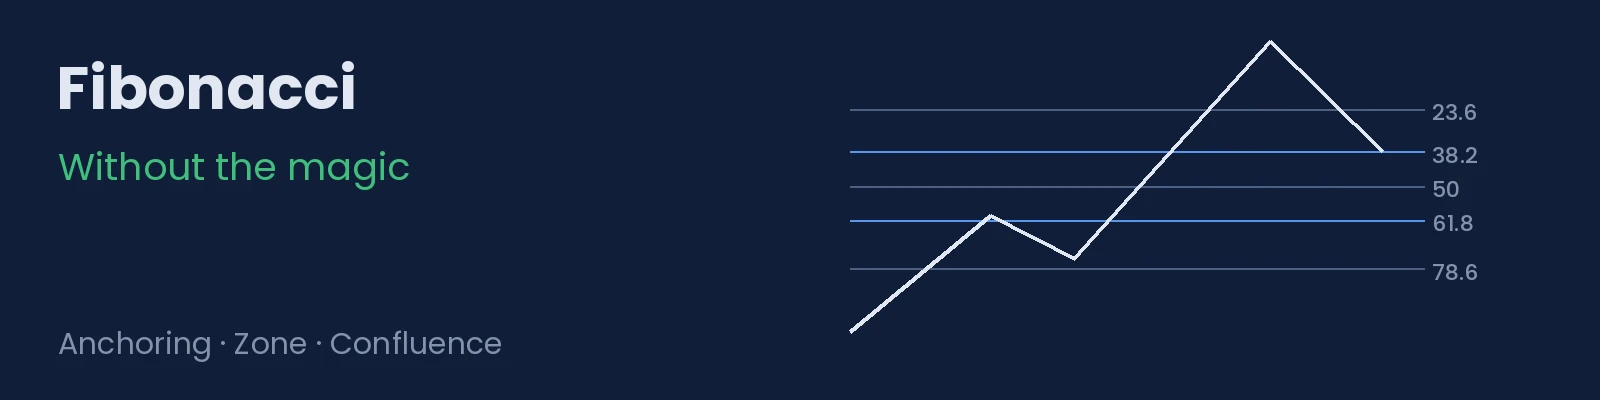
What Fibonacci levels are, why the result depends on where you anchor them, why they seem to work so often and how to use them as a reference zone in MT5.
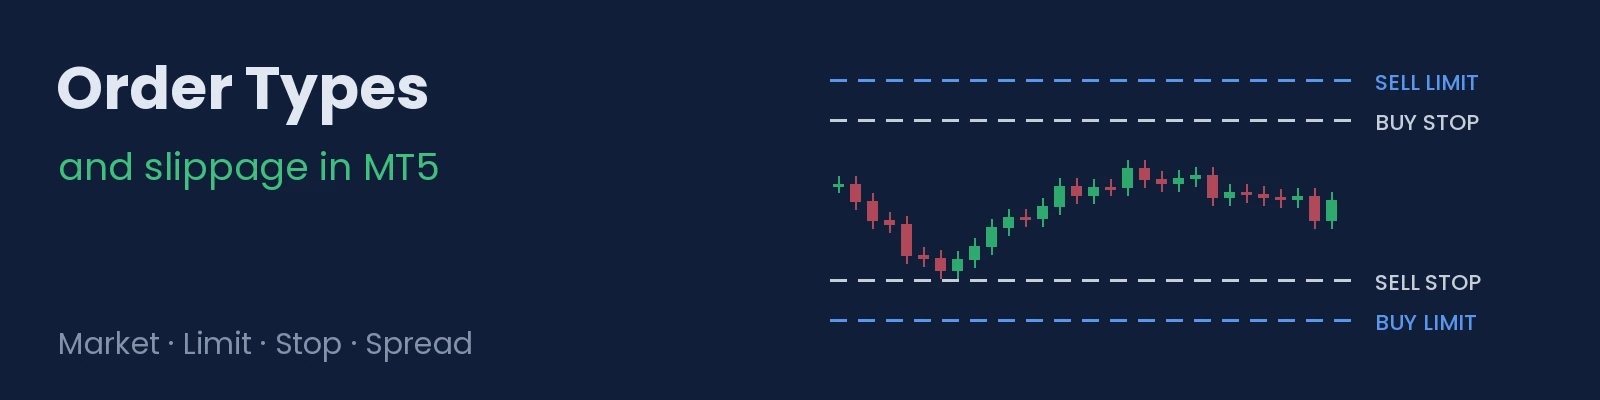
What each order type does in MT5, why a limit order is not filled even though the chart touches it, when slippage appears and how to reduce it.
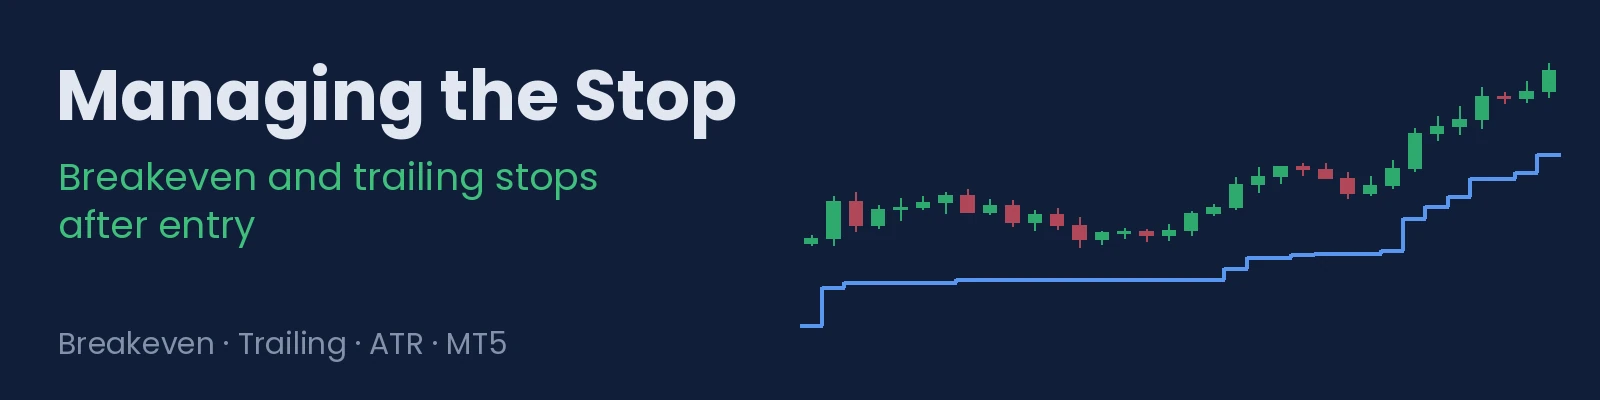
When to move the stop to the entry price, how much it can cost to do it too early, and how to follow price with a stop based on structure, a moving average or ATR in MT5.
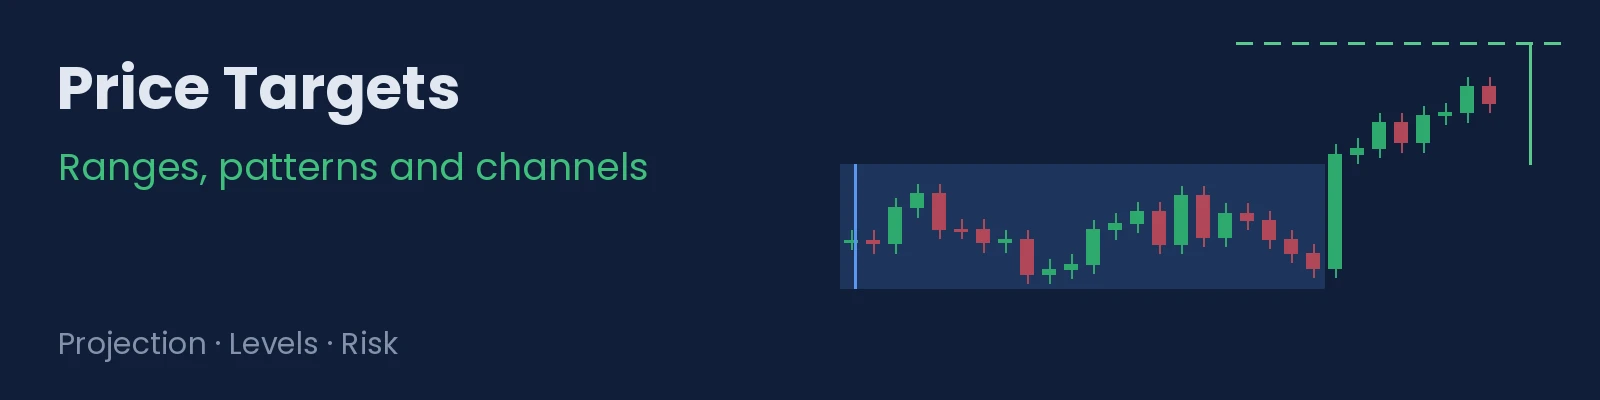
How to project a target from the height of a range, a pattern or a channel, how reliable it is, why to treat it as a zone and how to use it to decide whether a trade is worth taking.
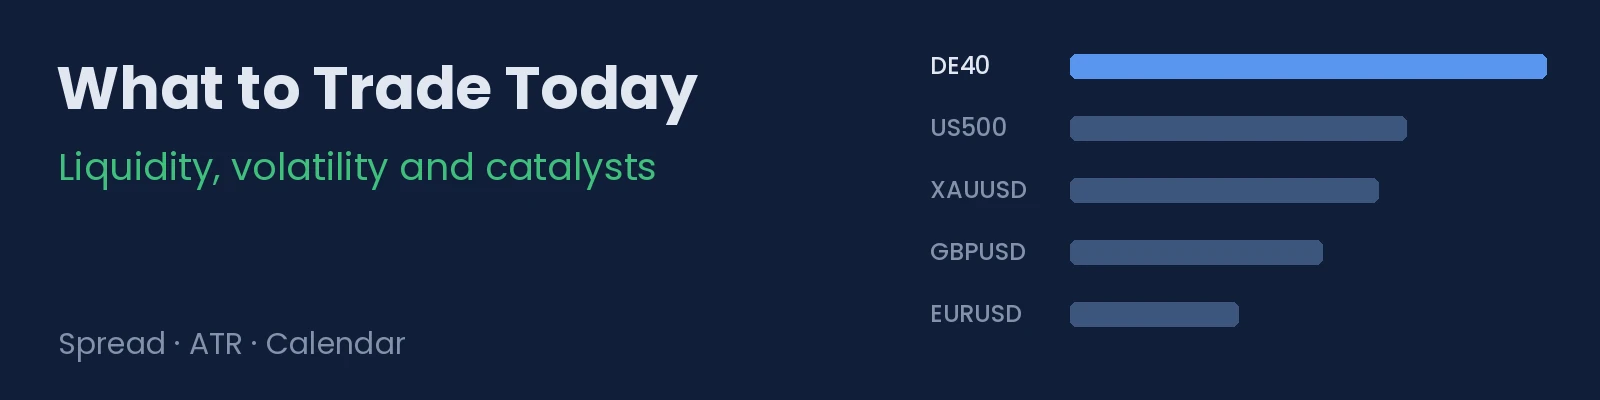
How to choose each day which assets on your list to trade: cost against movement, current volatility against normal, calendar catalysts and a ten-minute routine in MT5.
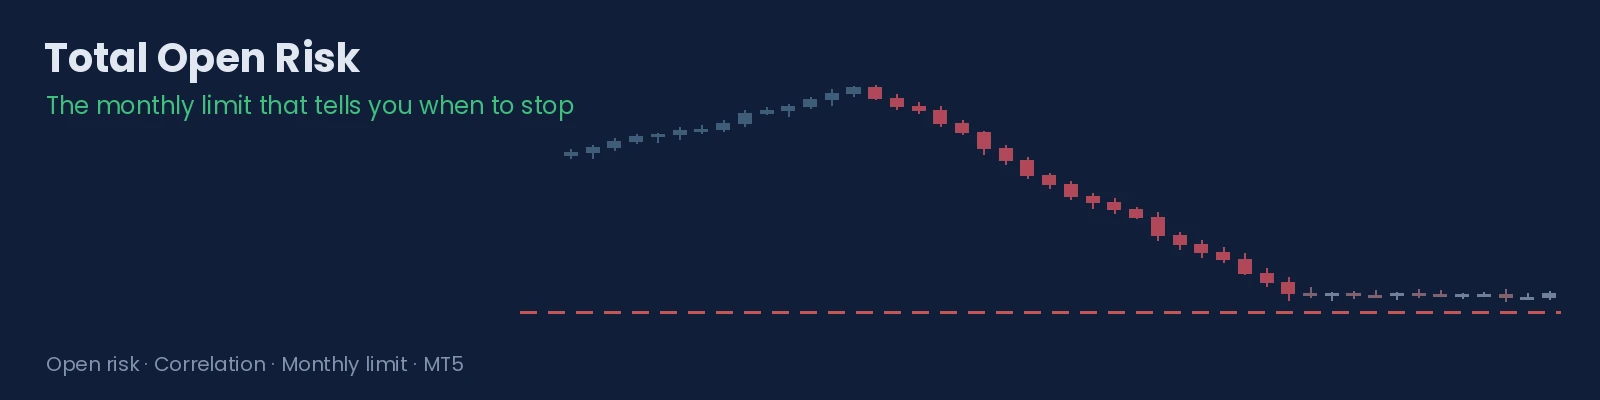
How to add up the risk of all your open positions, why correlated trades count as one, and how to set a monthly limit that tells you when to stop opening new trades.
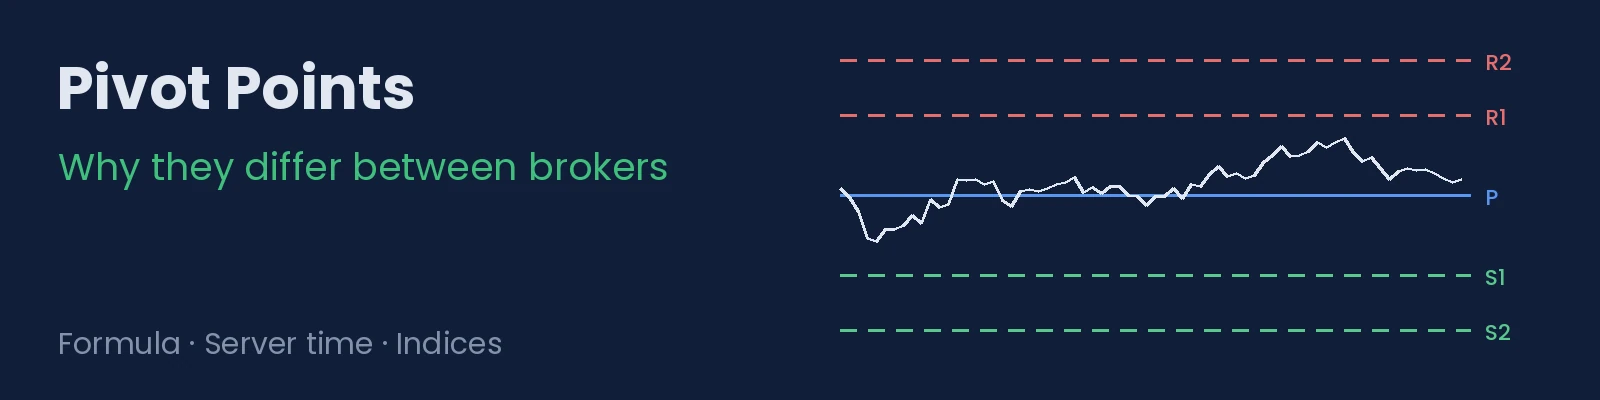
The classic pivot point formula, why two brokers show different levels for the same day, what happens with the Sunday candle and with indices, and how to use pivots as a reference.
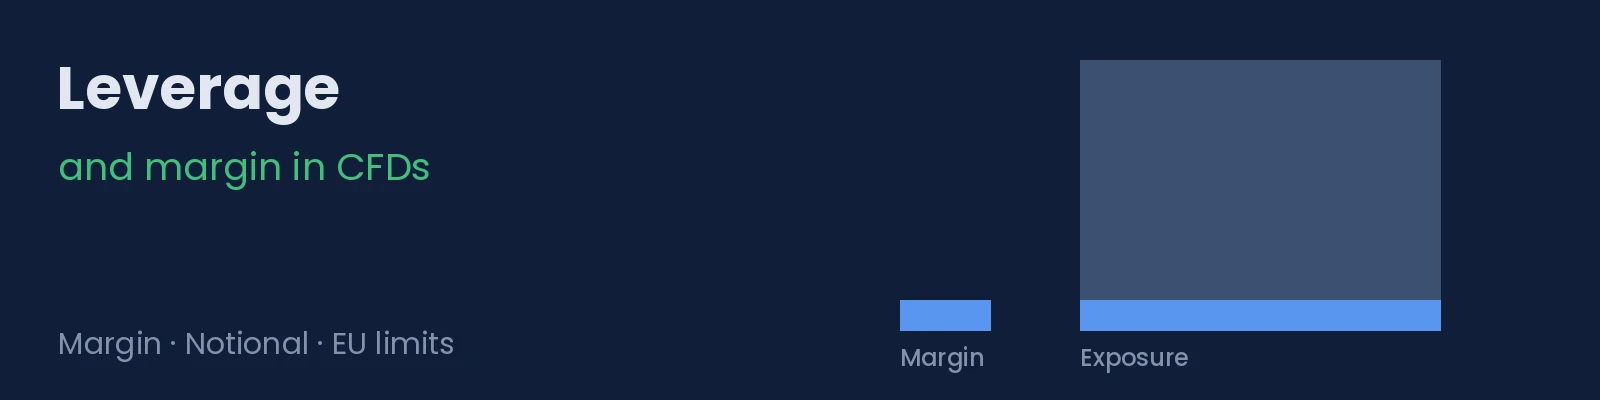
What margin is, why leverage does not change what you lose if your stop is hit, what effective leverage is and what limits apply to retail clients in the European Union.
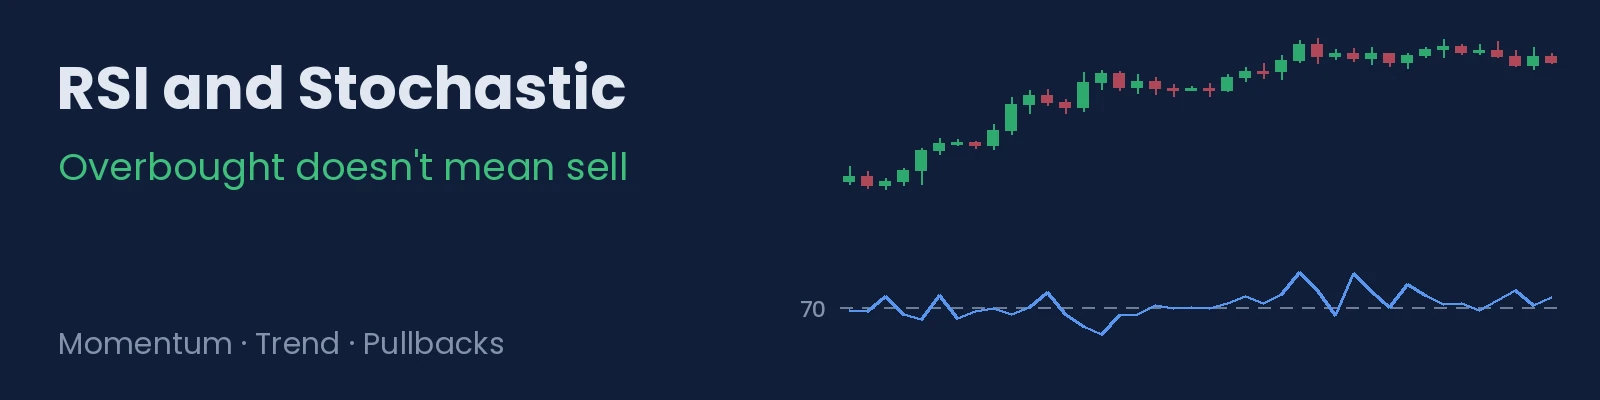
What RSI and the stochastic measure, why they can stay overbought for weeks during a trend and how to use them with the trend rather than against it in MT5.
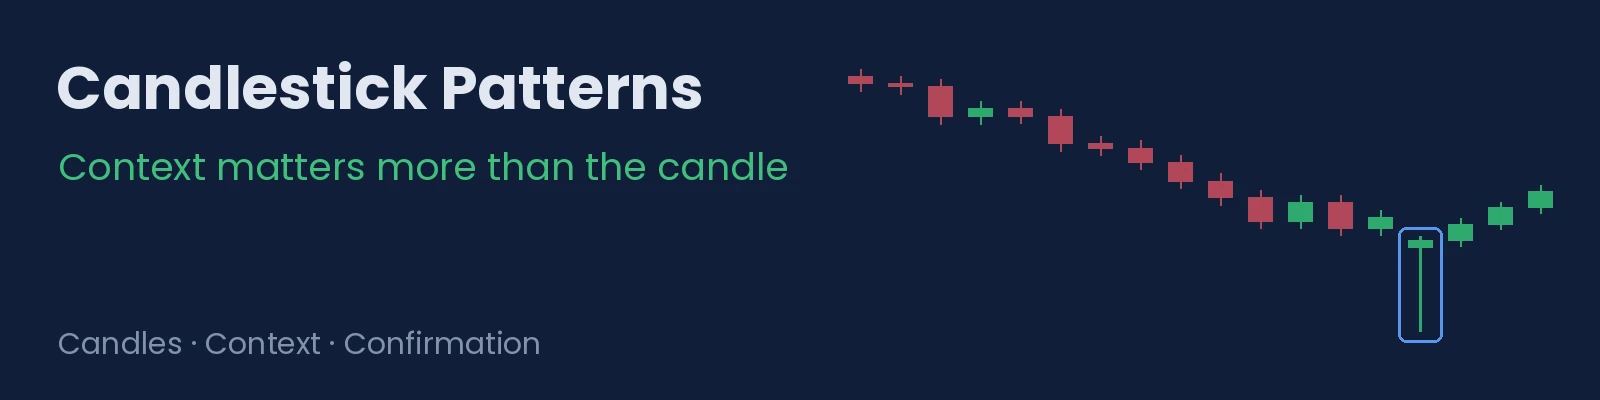
What a candle really tells you, why the same pattern means different things depending on where it appears, which patterns barely exist in 24-hour markets and how to check whether one works for you.
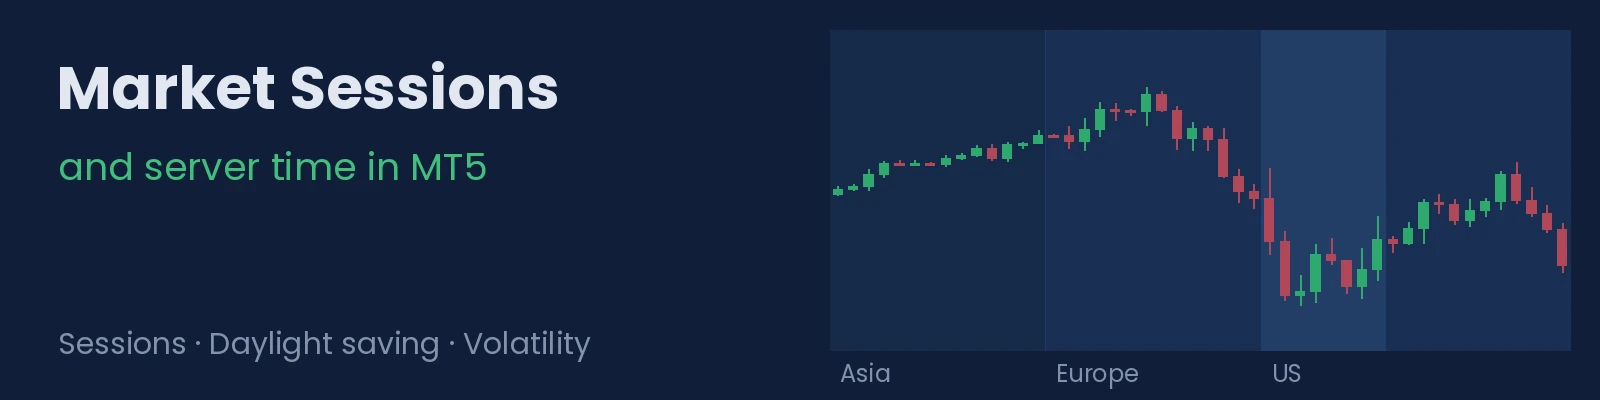
Why MT5 charts do not show your time, how to work out the difference with your broker's server, what happens in the daylight saving transition weeks and when each market moves.
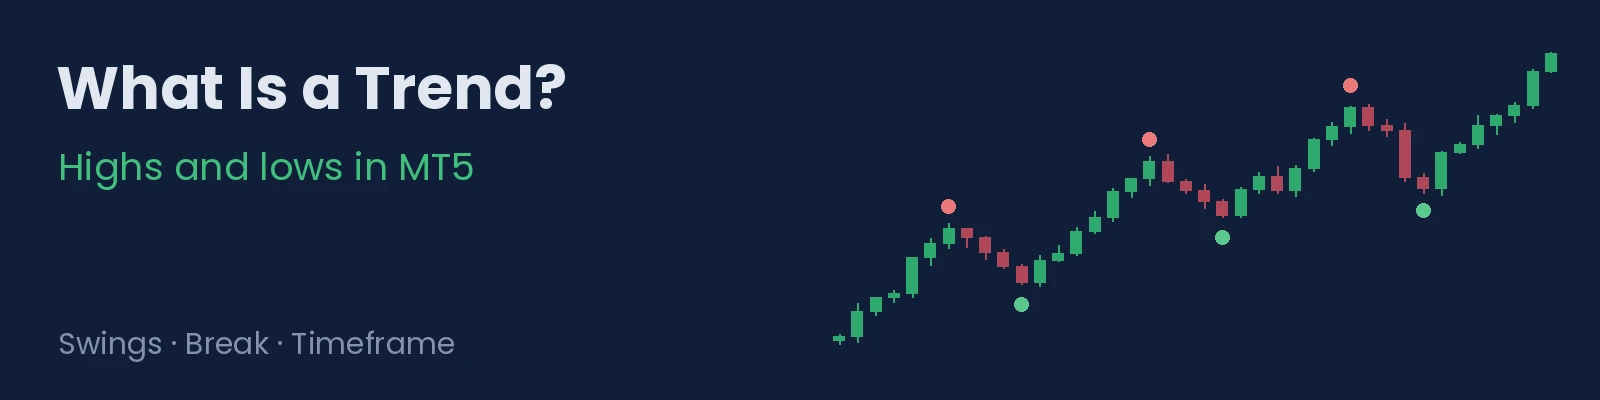
An objective definition of a trend based on highs and lows, how to decide which swing counts, when a trend is broken and how to mark it the same way every time in MT5.