

MACD in MetaTrader: Why It Looks Different from Other Platforms
What MACD calculates, why MetaTrader (MT4 and MT5) draws the main line as a histogram, how to see the classic histogram with OsMA and which reading makes sense without turning it into a signal machine.
If you have ever compared the MetaTrader MACD with the one on another charting platform, you probably thought one of them was wrong. Neither is: each platform draws the same indicator in its own way. The problem appears when an explanation written for one version is applied while looking at the other, because you end up reading something different from what you think. This article explains what MACD calculates, how the versions differ and how to get the classic one in MetaTrader.
1. What MACD calculates
MACD has three components:
- MACD line: the difference between a fast and a slow exponential moving average, 12 and 26 periods by default. It is positive when the fast average is above the slow one.
- Signal line: an average of the MACD line, 9 periods by default.
- Histogram: the difference between the MACD line and the signal line. It shows whether MACD is accelerating or slowing down.
In the most common version, used by many platforms and most books, the MACD line and the signal line are drawn as lines, and the histogram as bars.
2. What MetaTrader draws
The MACD that comes with MT4 and MT5 displays the indicator differently:
- The bars are the MACD line, not the difference from the signal.
- The dotted line is the signal, calculated as a simple average; that is why its parameter has “SMA” in its name.
- It does not show the classic histogram.
| What you see in MetaTrader | What it really is | Its equivalent in the classic version |
|---|---|---|
| Bars | MACD line (EMA 12 − EMA 26) | The MACD line |
| Dotted line | Signal (9-period simple average) | The signal line |
| — | — | The histogram (MACD − signal) |
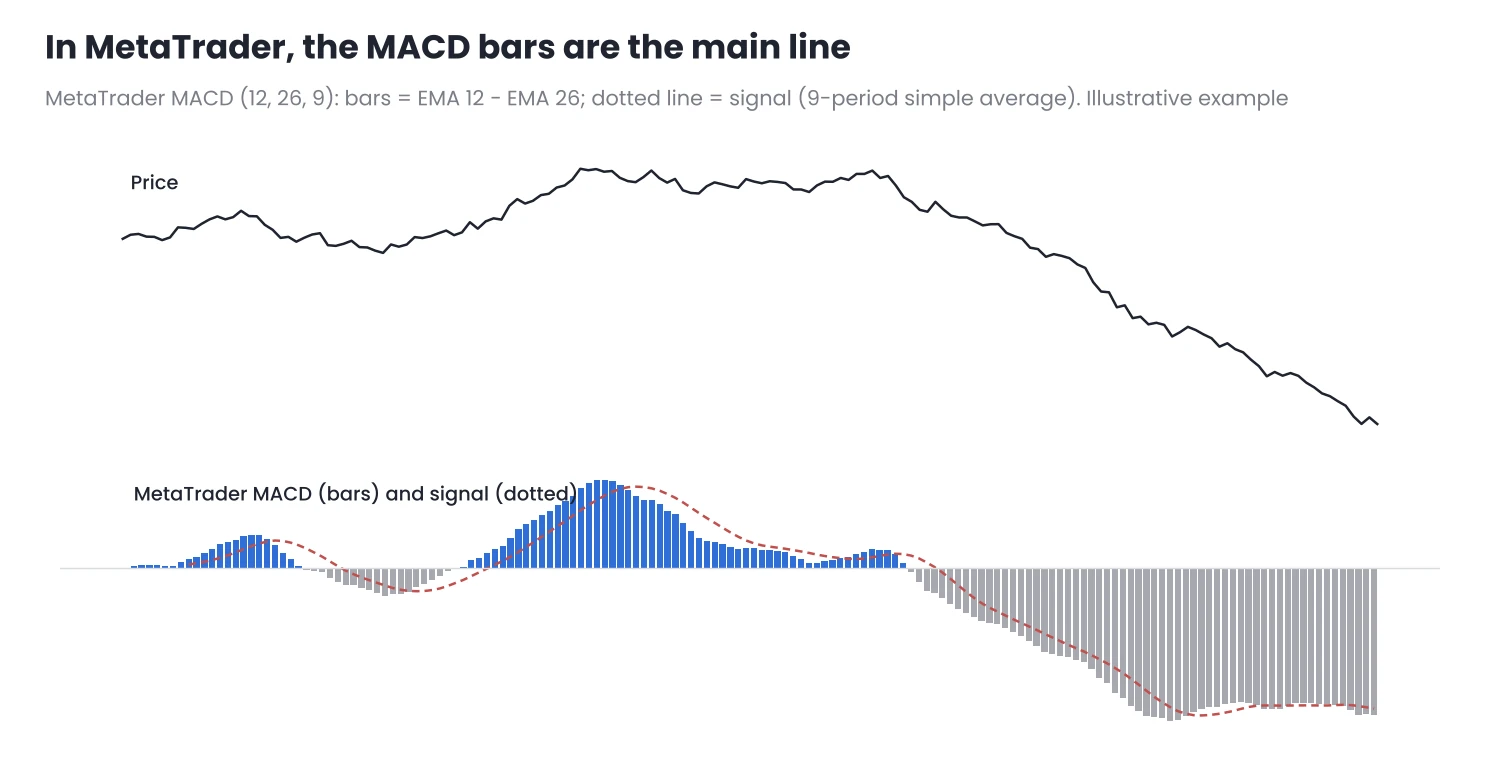
Figure 1. In MetaTrader, the MACD bars are the main line, not the classic histogram.
The practical consequence: when the MetaTrader MACD bars cross zero, what is happening is that the 12 EMA crosses the 26 EMA. In the classic MACD, by contrast, the histogram crosses zero when the MACD line crosses the signal line. They are two different events, at different moments.
Neither version is better. What matters is knowing which one you are looking at when you follow an explanation.
3. The classic histogram: OsMA
MetaTrader includes another indicator that does show the classic histogram: OsMA (Moving Average of Oscillator). It calculates exactly the difference between the MACD line and its signal.
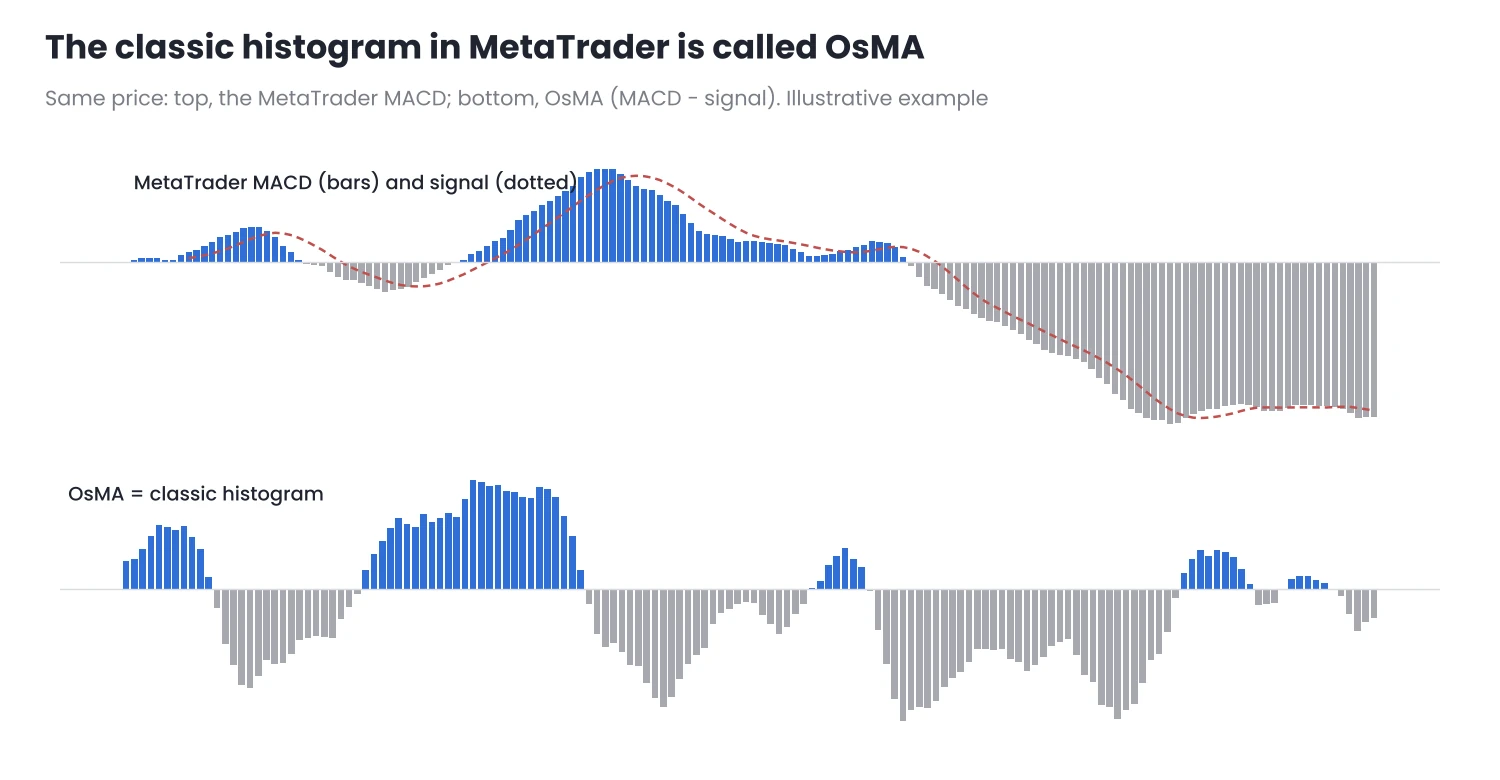
Figure 2. OsMA shows what other platforms call the MACD histogram.
If you follow a book or course that talks about the “MACD histogram”, in MetaTrader you need to look at OsMA, not at the MACD bars. Use the same parameters in both indicators so they match.
4. Which reading makes sense
- The MACD line summarises the relationship between two averages. Positive and rising: the fast average is pulling away above the slow one. It is a compact way of seeing the same thing as two moving averages, with the same lag. I explain this in Moving Averages: SMA, EMA and Why Crossovers Lag.
- The histogram measures whether that momentum is accelerating or slowing down. It can start falling while the price is still rising, and that only means momentum is fading.
- Divergences are looked for with a fixed criterion. Decide whether you compare the MACD line or the histogram, and do not switch. I explain how to mark them in Divergences.
What you should avoid is treating every crossover as an entry signal. MACD is built from averages, so it inherits their behaviour: it works reasonably in trends and gives false signals in ranges.
5. In MetaTrader
- Where they are: MACD and OsMA are under Insert → Indicators → Oscillators, in both MT4 and MT5.
- Parameters: the same in both indicators (12, 26 and 9 by default) so the comparison makes sense.
- If you compare with another platform, remember that some calculate the signal with an exponential average: crossovers will not land on exactly the same candle.
Common mistakes
- Comparing the MACD on two platforms and thinking one of them is wrong.
- Applying rules written for the classic histogram while looking at the MetaTrader MACD bars.
- Changing the parameters until it “works”. The values 12, 26 and 9 are nothing special, but changing them every week turns the indicator into something different each time.
Conclusion
- Each platform draws MACD in its own way. In MetaTrader, the bars are the main line and the signal is a simple average.
- The classic histogram in MetaTrader is OsMA, with the same parameters.
- Use it as a summary of momentum, not as a source of signals: it inherits the lag of the averages it is built from.
Open a chart, add MACD and OsMA with the same parameters and compare them with the MACD on any other platform. In a few minutes you will see what each thing is.
Want to bring this to your chart?
Jasopex tools for MetaTrader help you plan your risk before you trade.
See the tools