

Moving Averages in MT5: SMA, EMA and Why Crossovers Lag
What each MT5 moving average calculates, how much lag it has depending on its period, why a crossover confirms but does not anticipate, and how to use averages without depending on their signals.
Moving averages are the most widely used indicator and also one of the most misunderstood. Many traders treat them as entry signals, when in fact they only summarise what the price has already done. Knowing what each type calculates, how much lag it has and in which market its crossovers fail lets you use them for what they are good at. This article explains it with examples in MT5.
1. What each average calculates in MT5
The MT5 Moving Average indicator (Insert → Indicators → Trend) offers four methods:
- Simple (SMA): the arithmetic mean of the last N candles. All of them weigh the same, so a very old candle counts as much as the latest one.
- Exponential (EMA): gives more weight to recent candles. Each new candle enters with a weight of 2 ÷ (N + 1), and the weight of earlier ones fades gradually.
- Smoothed (SMMA): similar to the exponential one, but with a weight of 1 ÷ N. It is slower and roughly equivalent to an EMA of twice the period.
- Linear Weighted (LWMA): the weight falls in a straight line from the latest candle to the oldest one in the period.
Besides the method, the indicator asks for the period, the price it is calculated on (usually the close) and a shift. The shift only moves the line left or right on the chart: it does not make the average anticipate anything.
2. Lag: what no average can avoid
An average summarises the past, so it is always behind the price. The average lag of an N-candle SMA is (N − 1) ÷ 2 candles:
| Period | Average lag | On H1 this means |
|---|---|---|
| 10 | 4.5 candles | about 4 hours |
| 20 | 9.5 candles | about 9 hours |
| 50 | 24.5 candles | just over a day |
| 200 | 99.5 candles | more than four trading days |
Average lag of an SMA. Approximate values.
A surprising fact: an EMA of the same period has the same average lag. The difference is in how it is distributed. The EMA reacts sooner to a sharp move, because the latest candle weighs a lot, but it takes longer to forget the previous price completely. The SMA reacts more slowly at first, but after N candles it no longer remembers anything of the previous level.
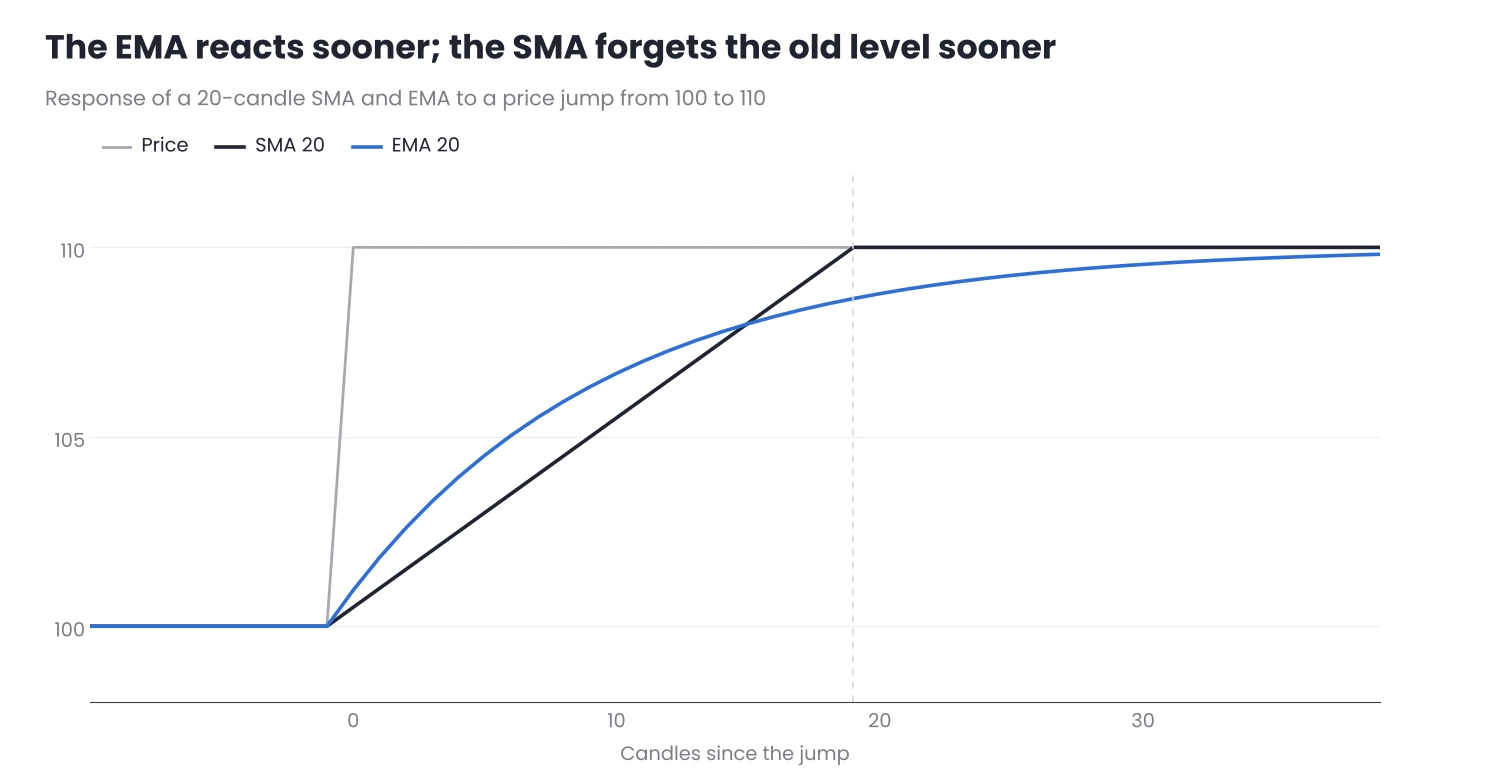
Figure 1. A 20-candle SMA and EMA after the price jumps from 100 to 110.
That is why there is no “lag-free” average. Reducing lag, with a shorter period or a more reactive average, always brings more noise: more changes of direction that lead nowhere.
3. Why crossovers lag
A crossover between a fast and a slow average can only happen after the price has turned, and has done so for long enough to move both averages. That is why a crossover confirms a change of direction but never anticipates it.
This has two consequences:
- In a trend, the crossover arrives late, but it arrives. It misses the beginning and the end of the move and captures the middle part.
- In a range, the crossover fails again and again. The price moves back and forth with no direction, the averages cross every few candles and each crossover is an entry that reverses shortly afterwards.
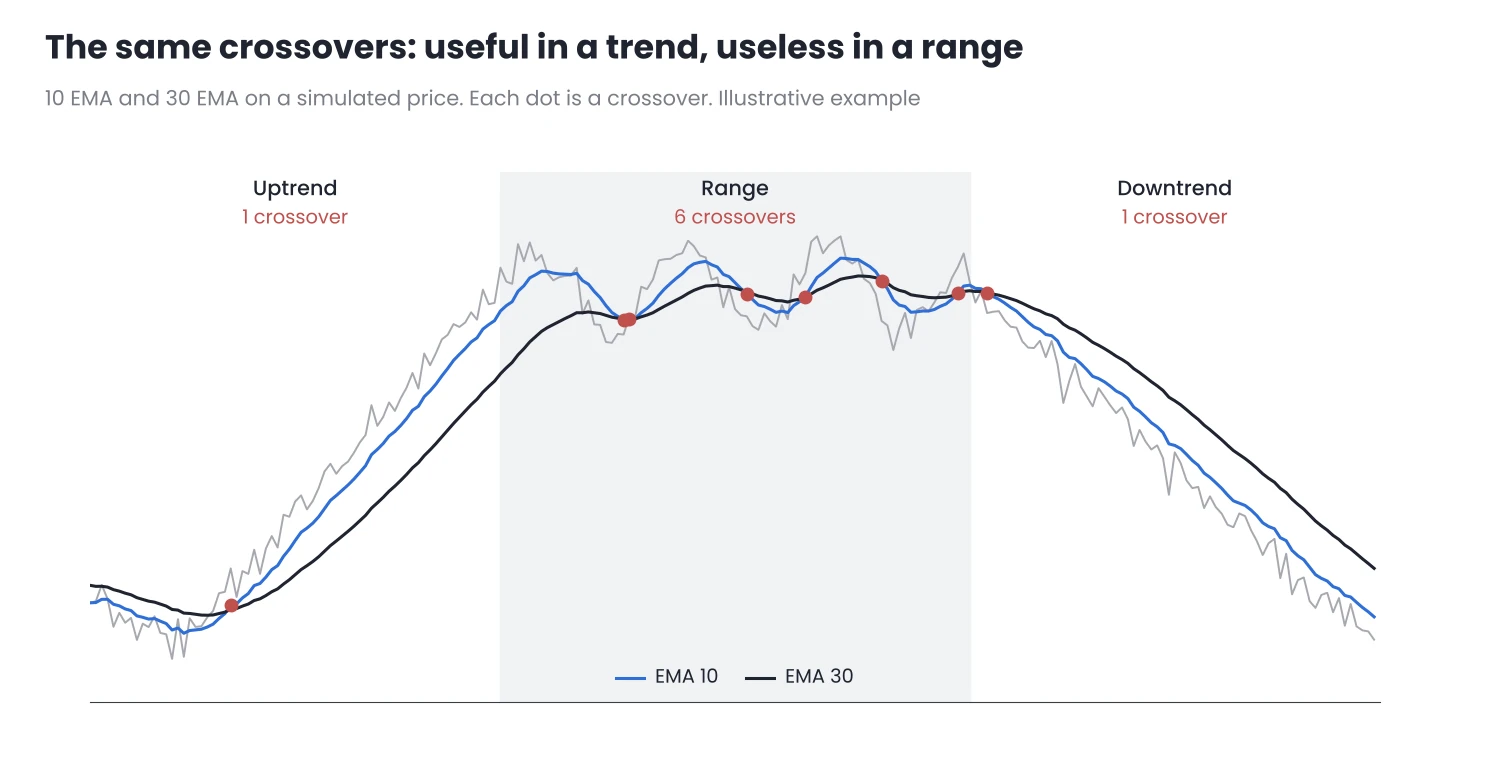
Figure 2. The same crossovers work in a trend and pile up with no result in a range.
This is why the results of a crossover strategy depend mainly on the type of market, not on choosing 9 and 21 or 10 and 30. Changing the periods until the system works on historical data usually fits it to a specific period that will not repeat in the same way.
4. What they are good for
Moving averages are useful when they are used as context rather than as a signal:
- To read direction. The slope of a long average, and whether the price is above or below it, gives a quick idea of the trend without drawing anything.
- As a reference zone on pullbacks. In a healthy trend, the price often returns to the area of a 20- or 50-candle average before continuing. It is a zone, not an exact level.
- As a filter. Taking only buys with the price above a long average and only sells below it removes many trades against the main trend.
- To manage the exit. An average can work as a trailing stop, closing when a candle closes on the other side. I explain this in Managing the Stop After Entry.
5. Common mistakes in MT5
- Comparing periods across timeframes. A 200 average on H1 is not the 200 on the daily chart: it covers about 200 hours, just over eight trading days in forex. If you want the daily reference on an H1 chart, look at it on the daily chart or multiply the period carefully.
- Using the shift as if it anticipated. An average shifted to the right seems to be ahead of the price, but it is only drawn somewhere else.
- Filling the chart with averages. Three or four different averages add no information: they all summarise the same price with different lags.
- Changing the period every week. If the periods change every time a trade goes wrong, you are no longer following a rule.
Conclusion
- Every average summarises the past. An SMA and an EMA of the same period have the same average lag; the EMA only reacts sooner to sharp moves.
- A crossover confirms, it does not anticipate. It works in trends and produces false signals in ranges, whatever combination of periods you use.
- Their best use is as context: direction, pullback zone, filter and exit reference.
Choose one or two averages, decide what you use them for and keep them fixed. Test them in the Strategy Tester or on a demo account before basing decisions on them.
Want to bring this to your chart?
Jasopex tools for MetaTrader help you plan your risk before you trade.
See the tools