

Managing the Stop After Entry: Breakeven and Trailing Stops
When to move the stop to the entry price, how much it can cost to do it too early, and how to follow price with a stop based on structure, a moving average or ATR in MT5.
Placing the initial stop is only the first decision. As soon as the trade moves in your favour, the temptation to protect it appears: moving the stop to the entry price, tightening it a little more or letting it follow the price. Each of these decisions changes the result of the strategy, and not always for the better. This article explains what each option does, how much it can cost and how to decide with your own data.
1. The only fixed rule: the stop only moves in your favour
Before looking at techniques, one rule with no exceptions: the stop can be moved closer to the price in the direction of the trade, but never further away. Widening the stop when the price approaches it turns a planned loss into a larger one and breaks the risk and position size calculation.
I explain where to place the initial stop in Where to Place a Stop Loss, on the MQL5 blog. Here I start from a trade that is already open with a well-placed stop.
2. Breakeven: what it protects and what it costs
Moving the stop to the entry price (breakeven) removes the risk of that trade. In the total open risk calculation it now adds 0, which leaves room for other trades. That is its real advantage.
The cost is less visible. Almost every winning trade pulls back at some point before reaching its target. If the stop is at the entry, some of those normal pullbacks close at zero trades that would have ended up winning.
Example with 100 trades
Suppose a strategy with a 40% win rate, a risk of 1R and a 2R target. Of the 60 losing trades, 20 reached +1R first. Of the 40 winning trades, 15 came back to the entry price after reaching +1R and then went on to the target.
| No breakeven | Breakeven at +1R | |
|---|---|---|
| Winners at +2R | 40 | 25 |
| Closed at 0 | 0 | 35 |
| Losers at −1R | 60 | 40 |
| Result | +20R | +10R |
Illustrative example. It does not include costs or slippage.
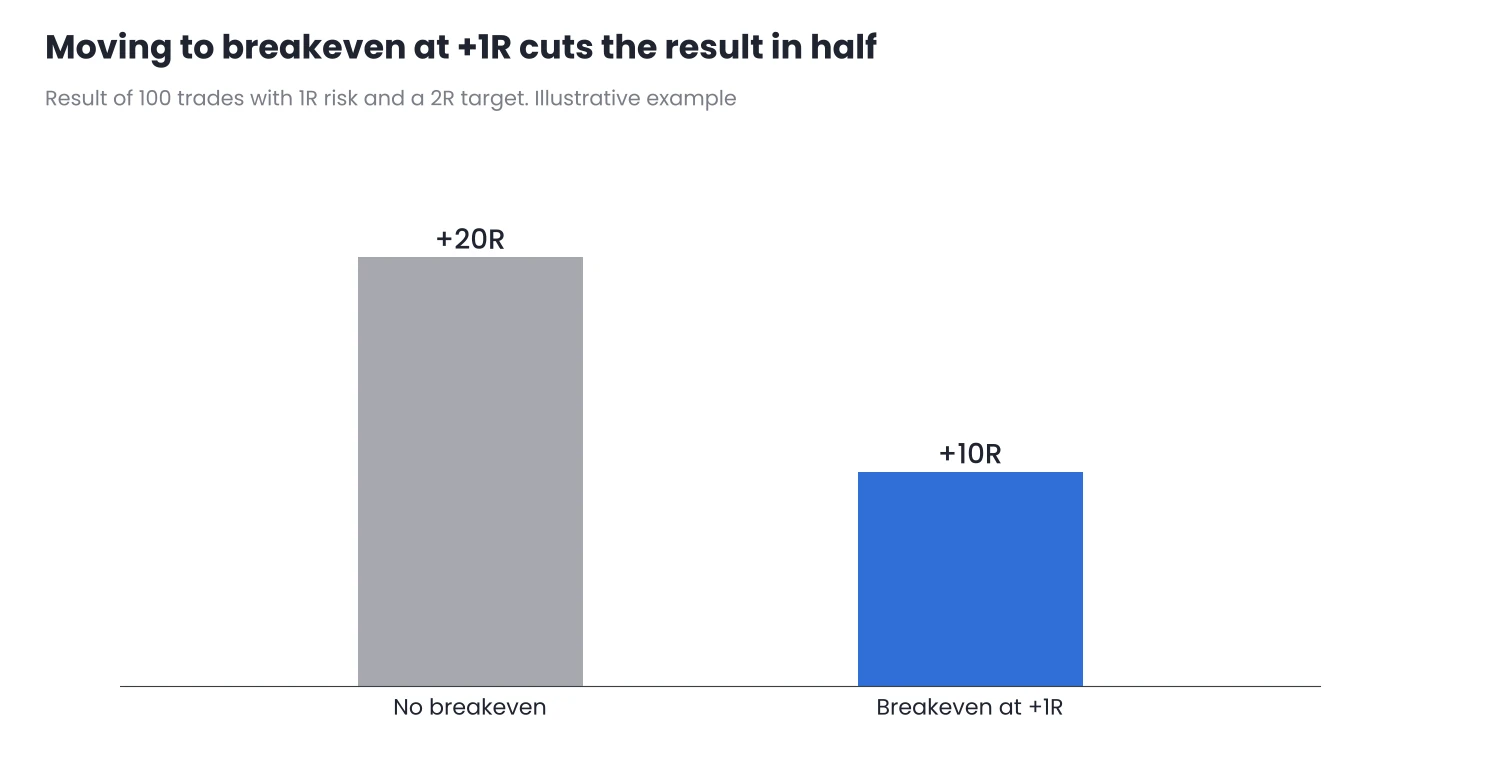
Figure 1. Breakeven saves 20R on the losers but costs 30R on the winners.
In this example, breakeven avoids 20 losses of 1R but turns 15 gains of 2R into zero. The balance is negative: the result is cut in half. With other data the balance can be positive, which is why the decision is not made by intuition, but by counting how many winners come back to the entry.
Three practical details
- A stop exactly at the entry does not leave the trade at zero. Commission, accumulated swaps and possible slippage remain. If you want a real breakeven, place the stop a few points beyond the entry to cover them. I explain this in Hidden Costs in Your Backtests.
- Move it by structure, not by distance. It makes more sense to move it to breakeven when the price forms a new low above the entry (on a buy) than when it reaches a fixed number of points.
- The broker may not allow a stop too close. In MT5, the symbol specification shows the Stops level: the minimum distance between the current price and the stop. If the price is closer, MT5 rejects the change.
3. Trailing stops: three ways to follow the price
A trailing stop follows the price as it moves forward and never moves back. The difference between the three usual methods is how much room it leaves.
By structure
The stop goes below the last relevant low (on a buy) and only moves when a new, higher one forms. It moves in steps and handles the normal pullbacks of a trend well. It works best on H4 or daily charts, where the lows are clear.
By moving average
The trade is closed when a candle closes on the other side of the chosen average, for example a 20-period EMA. Using the candle close rather than a simple touch avoids exits caused by a wick. The drawback is that the real stop is not on the server: you have to watch the close or code the exit.
By ATR
The stop goes a multiple of ATR below the highest price reached. With a multiplier of 2.5, the formula for a buy is:
Stop = highest price since entry − 2.5 × ATR (and never below the previous stop)
Example on an index on H4, with an entry at 20,000 and an initial stop at 19,800:
| Candle | High | ATR | High − 2.5 × ATR | Stop |
|---|---|---|---|---|
| 1 | 20,050 | 80 | 19,850 | 19,850 |
| 2 | 20,180 | 84 | 19,970 | 19,970 |
| 3 | 20,150 | 90 | 19,925 | 19,970 |
| 4 | 20,320 | 88 | 20,100 | 20,100 |
| 5 | 20,300 | 96 | 20,060 | 20,100 |
Illustrative example. The values do not correspond to any real market.
On candles 3 and 5 the calculation gives a lower level, but the stop does not move back. On candle 4 the stop is already above the entry: the trade has locked in a profit without a forced breakeven. ATR Volatility Monitor shows the asset’s ATR and draws an ATR trailing stop of this kind (a chandelier stop) on the chart, so you can see where it would sit without calculating it by hand. It only draws it: it does not open, close or modify trades.
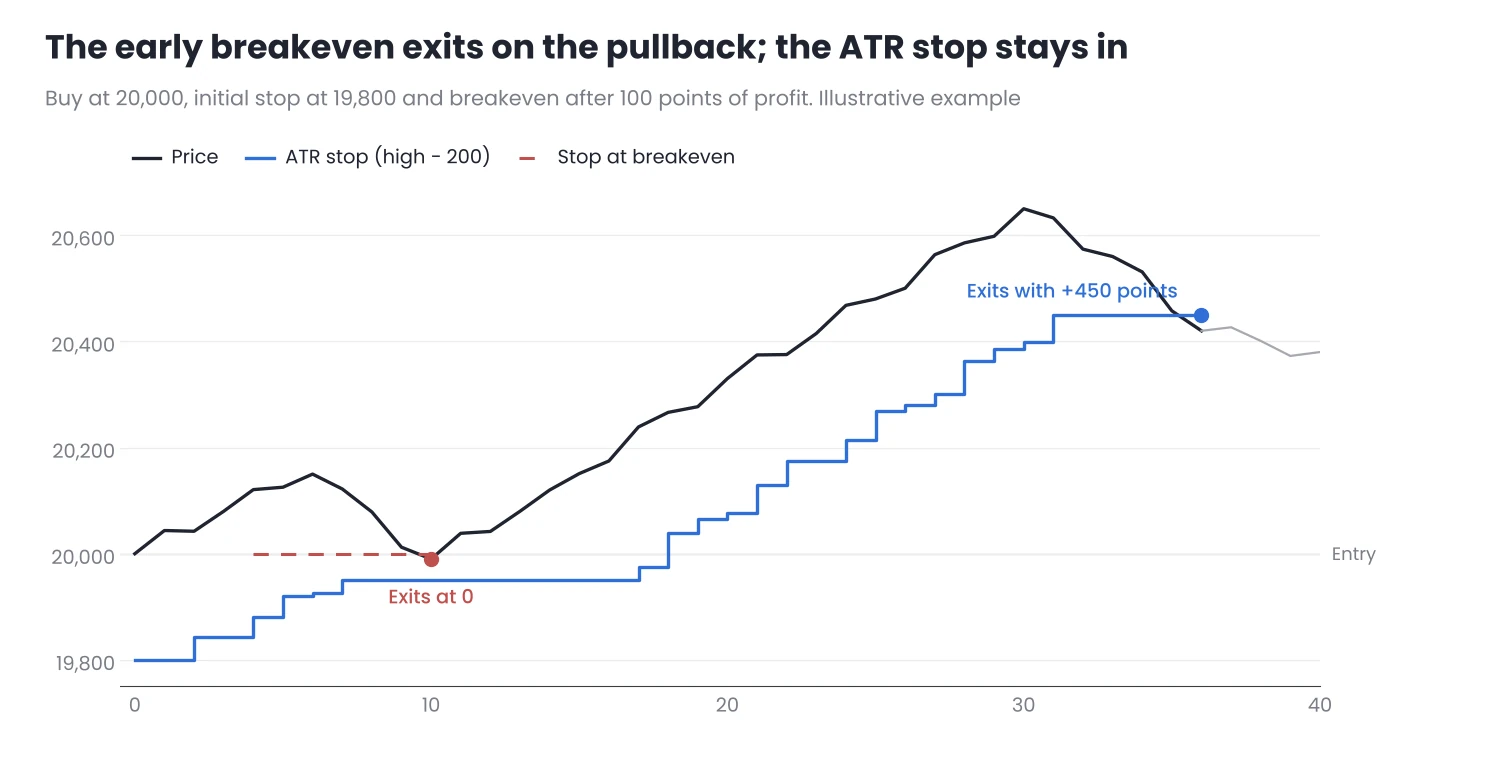
Figure 2. Early breakeven versus an ATR trailing stop on the same trade.
The built-in trailing stop in MT5
MT5 has its own trailing stop: in the Trade tab of the Toolbox, right-click the position and choose Trailing Stop. It has two limitations. The distance is fixed in points, so it does not adapt to volatility. And it runs in your terminal, not on the broker’s server: if you close MT5 or the connection drops, it stops moving the stop. To use it reliably, the terminal must stay open all the time, for example on a VPS.
4. Common mistakes
- Tightening the stop out of nerves. If the stop moves because the trade feels uncomfortable, and not because the structure has changed, management is no longer a plan.
- A trailing stop that is too tight. With less room than the asset’s normal pullback, the stop is hit at every pause in the trend.
- Changing method in the middle of the trade. Switching from a structure stop to an ATR stop because the second one is closer is just another way of improvising.
- Using the same distance on every asset. 50 points do not mean the same on DE40 as on EURUSD. ATR makes them comparable.
5. How to decide with your data
Stop management is part of the strategy, so it is tested just like the entry:
- In manual trading: record in your journal, for each trade, how far it moved in your favour before closing and whether it came back to the entry price. With 50 or 100 trades you will see whether breakeven saves you more than it costs you.
- In an EA: add the management method as a parameter (no breakeven, breakeven at +1R, ATR trailing) and compare the results in the Strategy Tester over the same period and with the same costs.
Conclusion
- The stop only moves in your favour. Widening it is never risk management.
- Breakeven has a cost. It removes the risk of the trade, but closes at zero some trades that would have won. Whether it pays off is something your data will tell you.
- A trailing stop must respect volatility. Whether based on structure, an average or ATR, it needs more room than the asset’s normal pullback.
Choose one way of managing the stop, write it in your plan before entering and apply it the same way to every trade. Test it first in the Strategy Tester or on a demo account to see how it changes your results.
Want to bring this to your chart?
Jasopex tools for MetaTrader help you plan your risk before you trade.
See the tools