
49 USDIndicator
Zone Risk Planner
Support and resistance zones turned into a plan with entry, stop, take profit and lot size, plus your whole account’s risk at a glance.

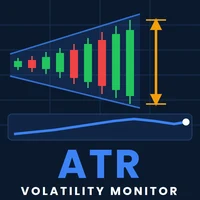
Uses the ATR to show, in a compact panel, how much the market is moving and whether that move is high, normal or low for the current asset. It also draws an ATR-based trailing stop (chandelier stop) on the chart.
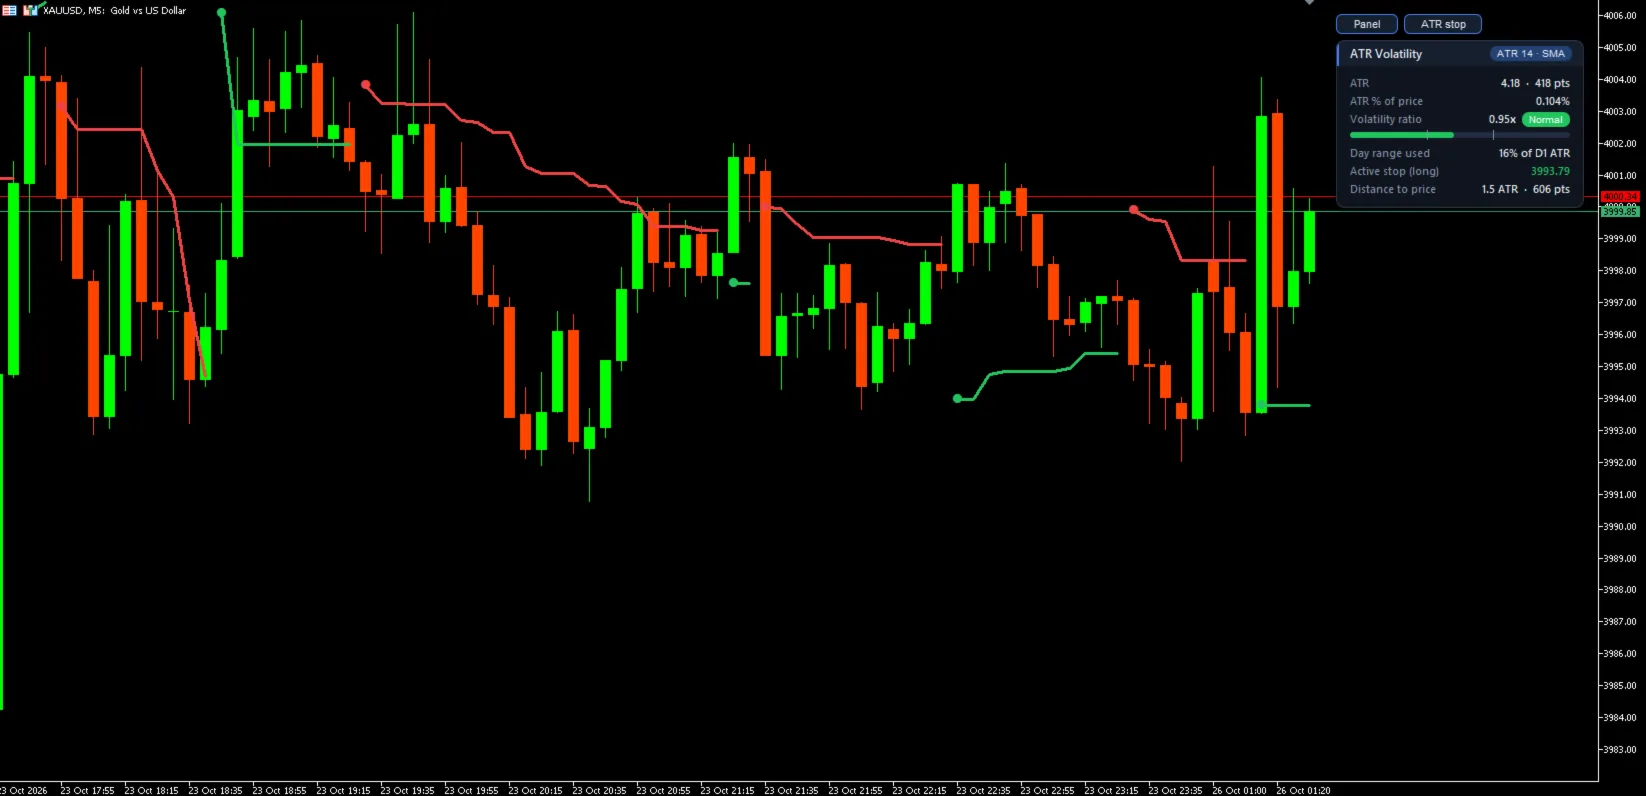
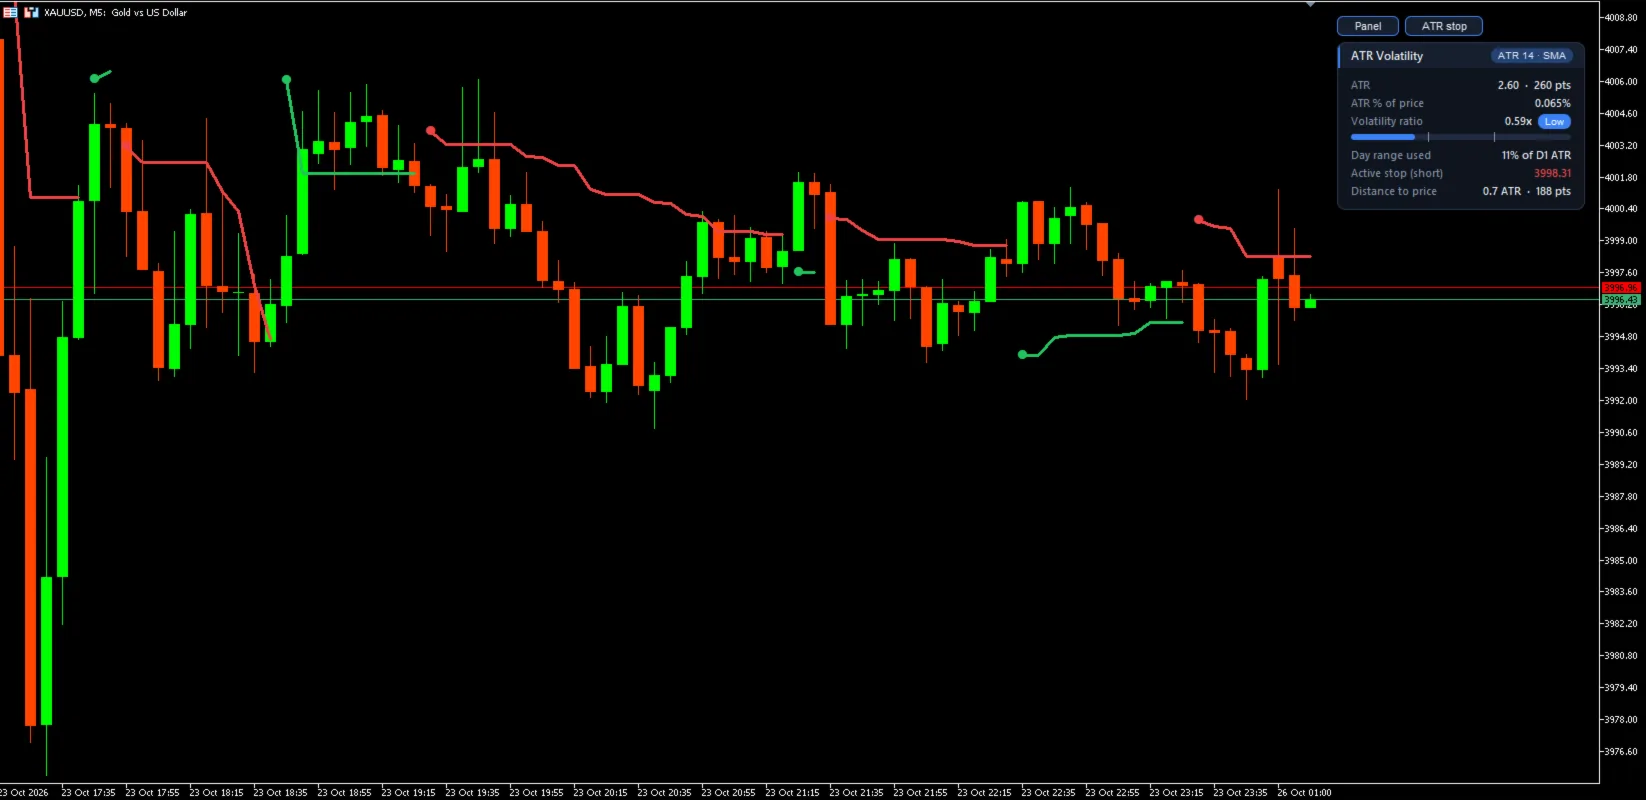
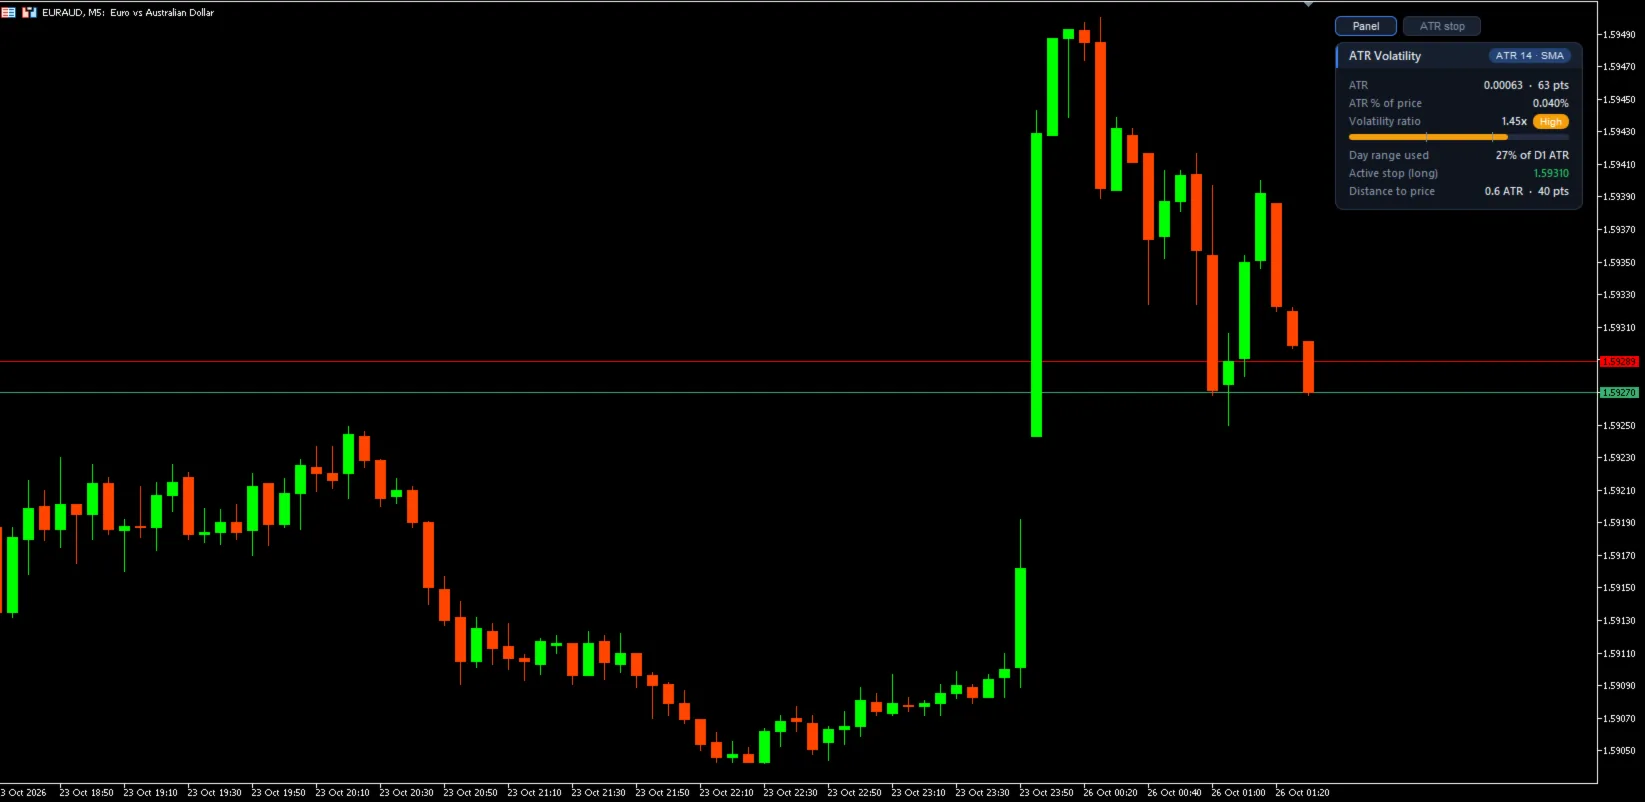
Screenshots taken on a demo account.
ATR period / ATR averageATR period and type of average.Average length / High / Low volatilityAverage length and the high and low volatility thresholds.Lookback (bars) / Multiplier kNumber of candles and ATR multiple for the trailing stop.Panel position / theme / languagePanel position, theme, language, colours and line width.This indicator is for information and education only and is not financial advice. The ATR measures past price behaviour and is not a forecast. Trading carries a high risk of loss. Try it first in the Strategy Tester or on a demo account.
Sign in with your MQL5 account.
It will appear in the MetaTrader Navigator, under Indicators → Market.
The full user guide is in the Comments tab of its Market page.
For now it is available for MetaTrader 5.
No. It gives you the information and the plan; the decision to trade is always yours.
In the Comments tab of its MQL5 Market page, in English.
No, it is free. Download it from the Market and try it on your chart, ideally on a demo account first.
It never sends, modifies or closes orders: it only works on the chart with the data it needs.
Download it free on the MQL5 Market
Support and resistance zones turned into a plan with entry, stop, take profit and lot size, plus your whole account’s risk at a glance.
The free version of Zone Risk Planner: support and resistance zones and a plan with entry, stop, take profit and lot size.

See everything on your chart and remove only what you choose, with protection for what you want to keep and an undo option.