

Total Open Risk and a Monthly Loss Limit
How to add up the risk of all your open positions, why correlated trades count as one, and how to set a monthly limit that tells you when to stop opening new trades.
Risking 1% per trade is a sound rule, but it does not say how much the account can lose at once. With five open positions at 1% each, the real risk to the account is 5%, and it can be higher if several of them depend on the same thing. This article explains how to measure that total risk, how to handle correlated trades and how to set a monthly limit that tells you when to stop.
1. What total open risk is
Total open risk is what the account would lose if the stops of all open positions were hit at the same time, measured from the entry price:
Total open risk (%) = sum of the losses to the stop of each position ÷ balance × 100
Three rules for calculating it correctly:
- A position with its stop at the entry price (breakeven) adds 0. One with its stop already in profit adds no risk either, although it can give back part of the gain.
- A position without a stop has unlimited risk. It cannot be added up, which is why no position should be open without a stop.
- Pending orders count too. If they can be triggered without you, their risk must fit inside the total before they are filled.
Example with a 10,000 USD account
| Position | Direction | Risk to the stop |
|---|---|---|
| EURUSD | Buy | 100 USD (1%) |
| GBPUSD | Buy | 100 USD (1%) |
| USDCHF | Sell | 100 USD (1%) |
| DE40 | Buy | 100 USD (1%) |
| XAUUSD | Buy, stop at breakeven | 0 USD (0%) |
| Total | 400 USD (4%) |
Illustrative example. It does not include spread, commission, swaps or slippage.
A stop does not guarantee the price
The calculation assumes that each stop is filled at its price. In practice, an opening gap or a news release can fill it much further away. If an index opens on Monday 150 points below your entry and the stop was 50 points away, the loss is three times the planned one: 3% instead of 1%. That is why open risk on Friday afternoon, or before a major release, should be lower than on a normal day.
2. Correlated trades: when several are really one
In the example above, buying EURUSD, buying GBPUSD and selling USDCHF look like three different trades. All three, however, win if the dollar weakens and lose if it strengthens. A single US jobs or inflation report can hit all three stops within the same hour.
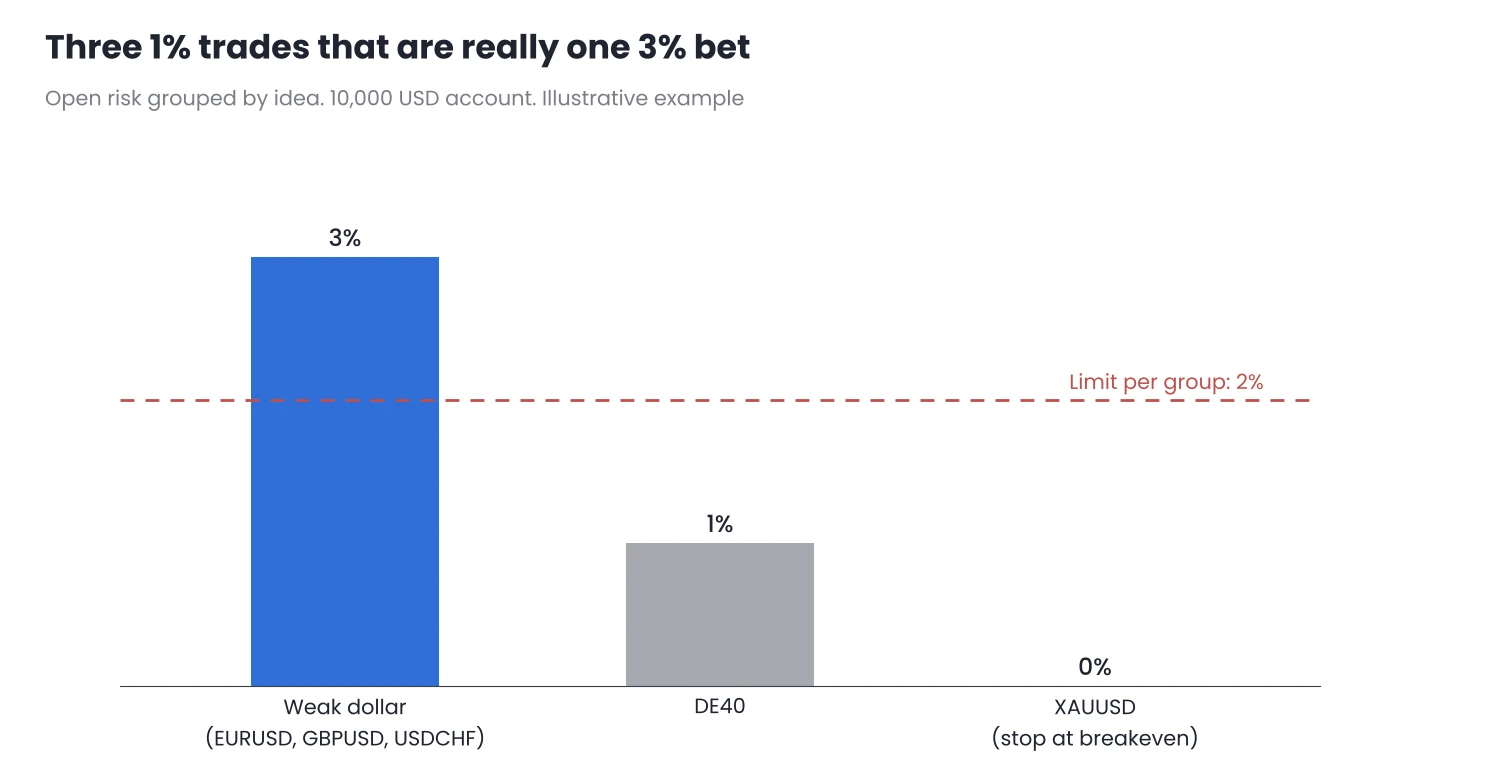
Figure 1. The same open risk, grouped by the idea behind each trade.
The practical way to deal with this is to group positions by what really moves them and to set a limit for each group:
- Currencies: positions that depend on the same currency in the same direction (all for or all against the dollar, for example).
- Indices: DE40, US500 and US100 tend to move together in sharp sell-offs, even if they do not every day.
- The same asset on several timeframes: two EURUSD trades, one on H1 and one on H4, are the same exposure.
With a 2% limit per group, only two of the three dollar trades in the example would fit, or all three with less risk each.
3. A limit for open risk
Total open risk needs its own limit, just like risk per trade. Before opening a new position, the check is simple:
Current open risk + risk of the new trade ≤ open risk limit
With a 5% limit and the example above (4% open), a new 1% trade just fits. A second one does not. In that case there are three reasonable options: wait for a position to close, open the new one with less risk, or wait until the market structure allows you to move a position to breakeven.
What you should not do is move existing stops closer just to make room for the new trade. A stop belongs where the trade stops making sense, not where it fits a sum.
4. The monthly loss limit
The open risk limit controls what can happen at once. The monthly limit controls what can happen over the month: once it is reached, no new trades are opened until the next month. Alexander Elder proposes a rule of this kind with 6% in The New Trading for a Living. The exact figure depends on each trader; what matters is the mechanism.
How it is calculated
The limit is measured on the balance of the first day of the month, which stays fixed until the month ends. The key is to add the losses already closed to what is still at stake:
Limit used = net closed loss in the month + total open risk
If the closed result for the month is positive, it counts as 0. That way, the month’s profits do not increase the risk you can take.
Counting open risk is what makes the limit work. If only closed losses were counted, a trader with −5% closed and 4% open would still think there was room, and could end the month at −9%.
Example over one month
10,000 USD account at the start of the month, 1% risk per trade and a 6% monthly limit (600 USD):
| Day | Net closed loss | Open risk | Limit used | Room left |
|---|---|---|---|---|
| 3 | 100 USD | 300 USD | 400 USD | 200 USD |
| 7 | 300 USD | 100 USD | 400 USD | 200 USD |
| 10 | 150 USD | 200 USD | 350 USD | 250 USD |
| 14 | 450 USD | 100 USD | 550 USD | 50 USD |
Illustrative example. It does not include costs or slippage.
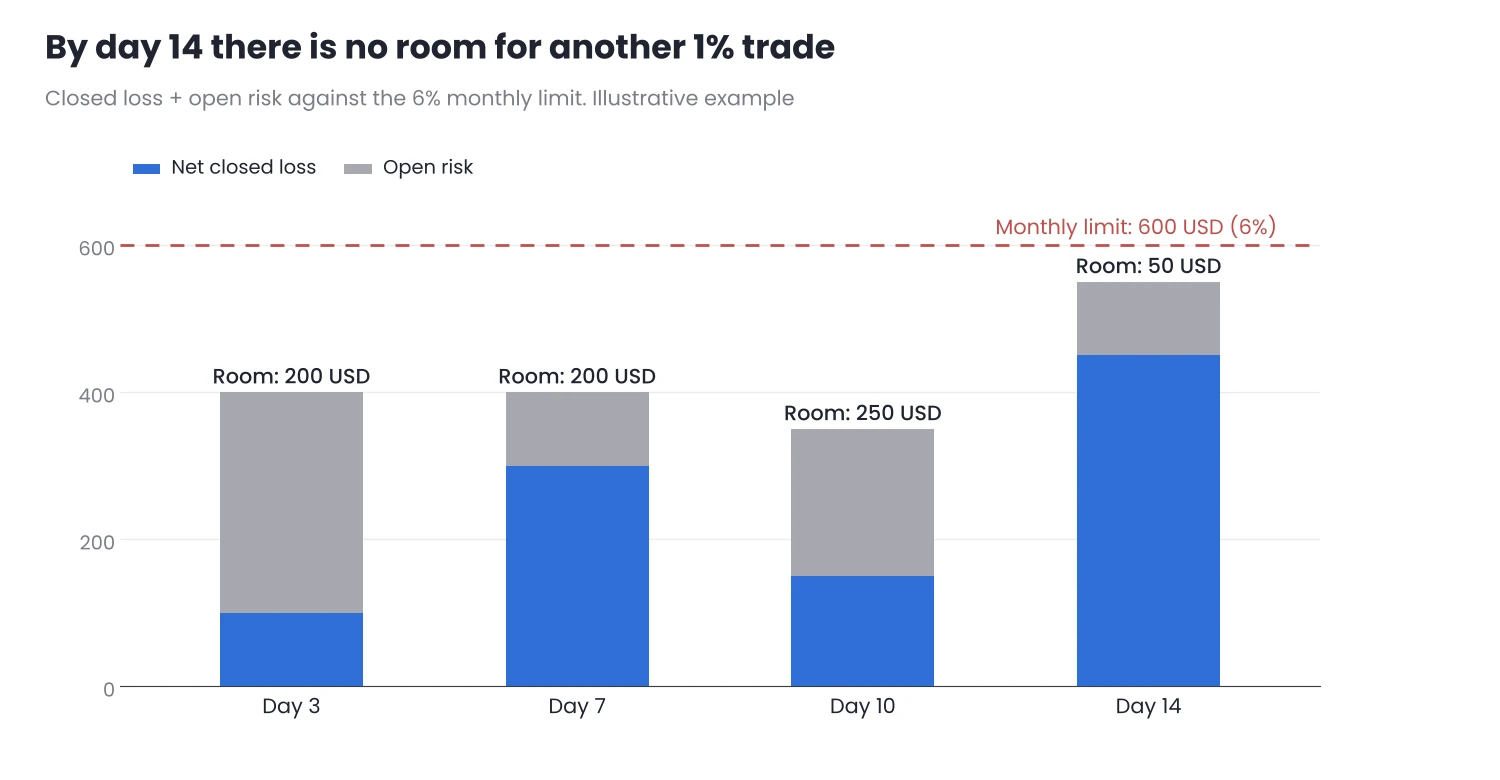
Figure 2. Closed loss and open risk against the 6% monthly limit.
On day 14 there are 50 USD of room left, less than the risk of a normal trade. From then on, no new trades are opened this month. The open position keeps its original stop; it is not widened to avoid being hit.
How to choose the limit
The ratio between the monthly limit and the risk per trade tells you how many full losses fit before you stop. With 1% per trade and 6% per month, six fit.
- If the limit is too low, it will be hit in many normal months, because losing streaks are part of any strategy. In my article Drawdown and Recovery on the MQL5 blog I explain what streak length is normal for each win rate.
- If the limit is too high, it barely protects you: by the time it is reached, the damage is done.
Reaching the limit does not mean the strategy has stopped working. It means it is time to stop, review the month’s trades and check whether the losses come from the strategy or from the execution.
5. How to track it in MT5
MT5 does not show total open risk or a monthly limit, but the data to calculate them is in the Toolbox window:
- Risk of each position: when you open an order, write its risk in the Comment field, for example
R=100. In the Trade tab, right-click and enable the Comment column: you will see the risk of each position without recalculating it. - Result for the month: in the History tab, right-click and choose a Custom period from the first day of the month to today, so that it covers the calendar month. Check that the result includes commission and swaps, since they are losses too.
- If you run EAs on the same account, their risk counts too. Add the risk of their open positions to the total, or give them a fixed share of the limit.
To know the risk of each trade before opening it you can use Zone Risk Planner, which calculates the lot from the zone, the stop and your risk, and also shows the risk of your whole account. Its free version, Zone Risk Planner Core, handles the planning of each trade. Neither of them opens or closes trades.
Conclusion
- The account’s risk is the sum of everything open, not the risk of one trade. Positions at breakeven add nothing; positions without a stop cannot be measured.
- Correlated trades count as one bet. Group them by what moves them and set a limit for each group.
- The monthly limit adds what has been lost to what is at stake, on the fixed balance of the start of the month. When it is reached, you stop opening trades until the next month.
Set these figures before the month starts, write them in your trading plan and check them before every new trade. Test them on a demo account first to see how often they are hit with your way of trading.
Want to bring this to your chart?
Jasopex tools for MetaTrader help you plan your risk before you trade.
See the tools