

Divergences: When They Warn and When They Fail
What a divergence between price and an oscillator is, why a trend can produce several before turning, how to confirm it with structure and how to mark divergences the same way every time in MT5.
Divergences have a reputation for anticipating market turns. Sometimes they do. Other times the price keeps going in the same direction for weeks, with one divergence after another. The problem is not the divergence, but treating it as an entry signal. This article explains what a divergence is, why it appears, why it fails so often and how to use it for what it is: a warning.
1. What a divergence is
There is a divergence when the price and an oscillator, such as RSI or MACD, do not confirm the same move:
- Bearish divergence: the price makes a higher high, but the oscillator makes a lower high.
- Bullish divergence: the price makes a lower low, but the oscillator makes a higher low.
There is also the so-called hidden divergence, which is read in the direction of the trend:
- Hidden bullish: the price makes a higher low (a pullback in an uptrend), but the oscillator makes a lower low.
- Hidden bearish: the price makes a lower high, but the oscillator makes a higher high.
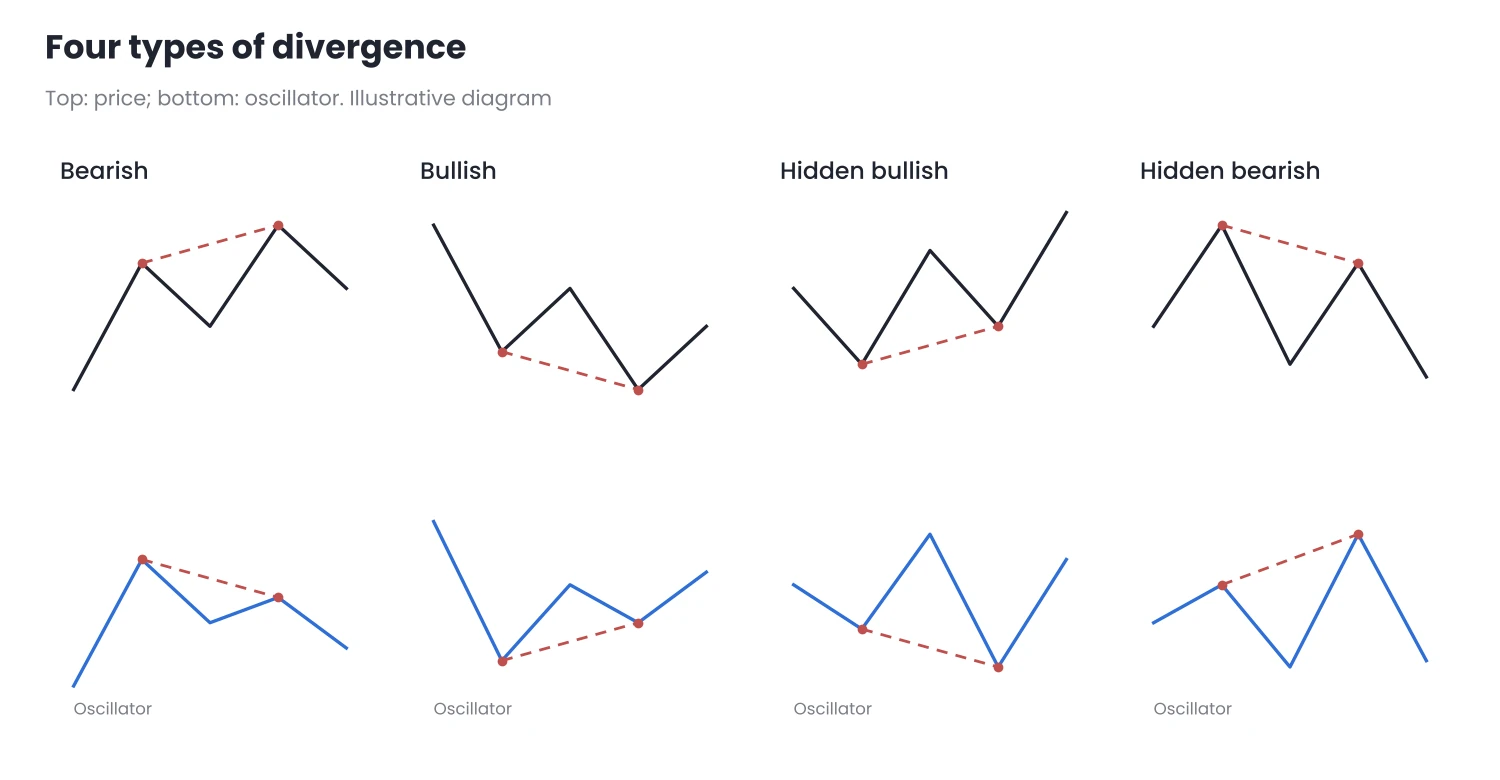
Figure 1. The four types of divergence between price and an oscillator.
2. What it really means
An oscillator measures the momentum of the recent move. A bearish divergence shows that the last rally had less momentum than the previous one. That is all it says.
Less momentum does not mean a turn. A trend can keep rising with ever slower legs, or pause in a range before continuing. That is why, in strong trends, it is common to see two or three divergences in a row before the price really turns, if it turns at all.
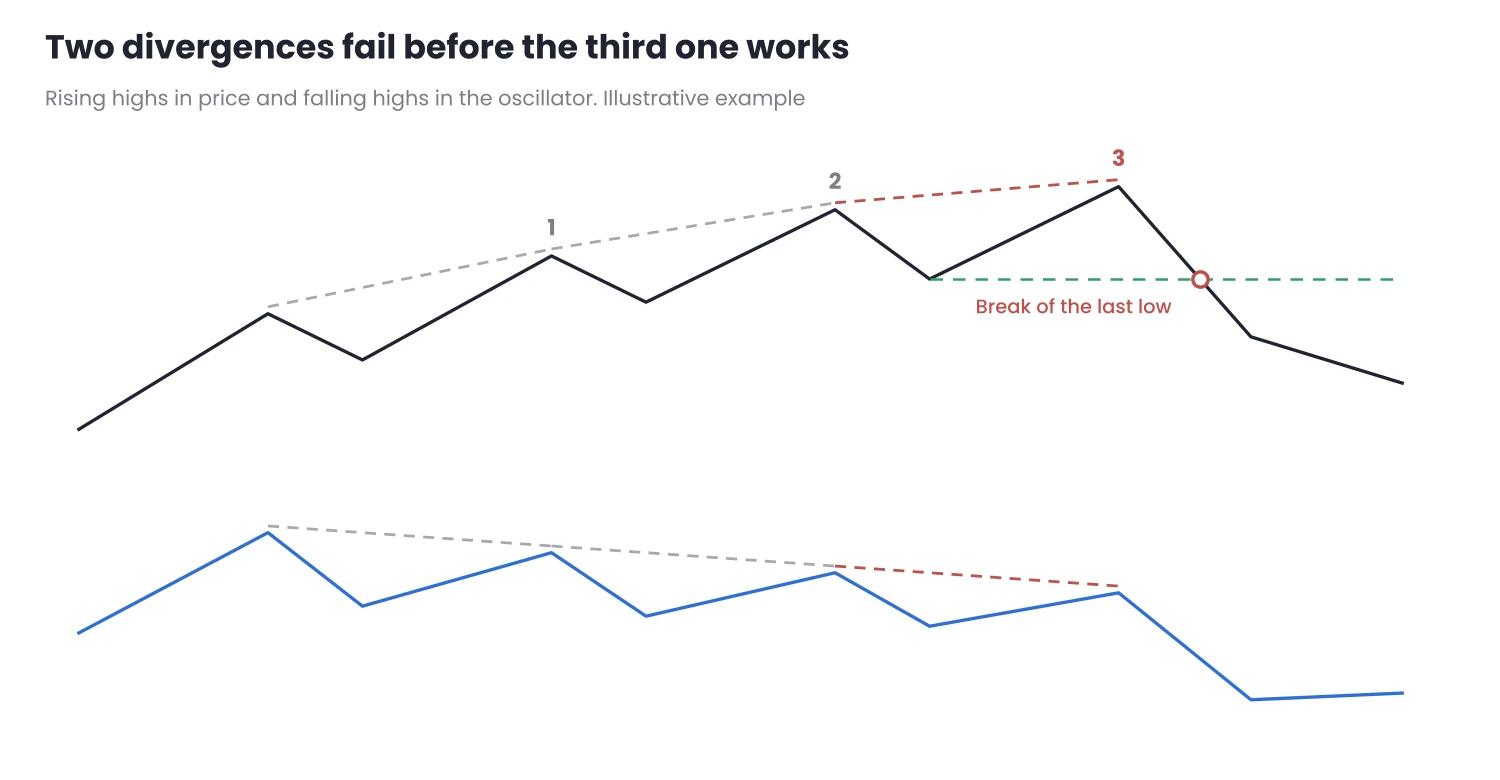
Figure 2. The first two divergences lead to no turn; the third does, but it is only confirmed by the break of the last low.
Anyone who sells on the first divergence in the figure collects two losses before getting the third one right, and only if they stick with the method.
3. How to use it: as a warning, not as an entry
The most solid way to use a divergence is to combine it with price structure:
- The divergence warns. Momentum is fading on that timeframe.
- Structure confirms. The turn is only confirmed when the price closes beyond the last relevant low (for a bearish divergence) or the last high (for a bullish one). I explain this in What Is a Trend?.
- In the meantime, manage what you already have. If you are in a trade with the trend, a divergence can be a good time to tighten the stop by structure, as I explain in Managing the Stop After Entry, but not to open an opposite trade.
Hidden divergences follow the same logic in reverse: they show that the pullback was deep on the oscillator but not on price, and they are usually read as a possible continuation of the trend. They also need the price to confirm.
4. How to mark them the same way every time in MT5
Many divergences “appear” because points are chosen after the fact. To avoid this:
- Compare only confirmed swings. Use the same rule for price highs and lows that you use to define the trend, for example swings with two or three candles on each side.
- Align the points. The oscillator high you compare must coincide with the price high, not sit several candles before or after it.
- Use a single oscillator. RSI or MACD, but always the same one with the same parameters.
- Watch out for the MT5 MACD. The MACD that comes with MT5 draws the main line as a histogram and the signal as a dotted line, unlike other platforms. To look for divergences, compare the histogram’s highs and lows.
Common mistakes
- Seeing divergences everywhere. If you compare any pair of points, you will always find one.
- Trading against a strong trend because of a divergence on a lower timeframe. A divergence on M15 within an H4 uptrend is usually just a pullback.
- Entering before confirmation. Without a break in structure, the divergence only says that momentum has dropped.
Conclusion
- A divergence signals less momentum, not a turn. Strong trends can produce several before turning.
- Price structure is what confirms. The turn starts when the price closes beyond the last relevant low or high.
- Mark divergences with fixed rules: confirmed swings, aligned points and always the same oscillator.
Go back through your history to the last divergences you saw and check how many led to a turn and how many did not. Run these tests on a demo account.
Want to bring this to your chart?
Jasopex tools for MetaTrader help you plan your risk before you trade.
See the tools