

What Is a Trend? How to Define It with Highs and Lows
An objective definition of a trend based on highs and lows, how to decide which swing counts, when a trend is broken and how to mark it the same way every time in MT5.
“Trade with the trend” is one of the most repeated pieces of advice, but it is rarely explained what a trend actually is. If two traders look at the same chart and one sees an uptrend while the other sees a range, the advice is not much use. This article proposes a definition based on highs and lows that can be applied the same way every time, and explains how to mark it in MT5.
1. The definition: highs and lows
The most objective way to define a trend is to look at the sequence of price highs and lows:
- Uptrend: each high is higher than the previous one, and so is each low.
- Downtrend: each high is lower than the previous one, and so is each low.
- Range: the highs and lows follow neither sequence.
The definition needs no indicator. Its weak point lies elsewhere: you have to decide what counts as a high or a low.
2. Which swing counts as a high or a low
Any candle that rises after a falling one forms a small low. If all of them count, the chart fills up with swings and the trend changes every few candles. You need a rule.
A simple rule is confirmed swings: a candle is a high if the N candles before it and the N candles after it all have lower highs. With N = 2 this is what the MT5 Fractals indicator draws (Insert → Indicators → Bill Williams).
| Candles on each side (N) | Swings detected | Delay to confirm |
|---|---|---|
| 2 | Many, including small pullbacks | 2 candles |
| 3 | A middle ground | 3 candles |
| 5 | Only the major swings | 5 candles |
Indicative values. The number of swings depends on the asset and the timeframe.
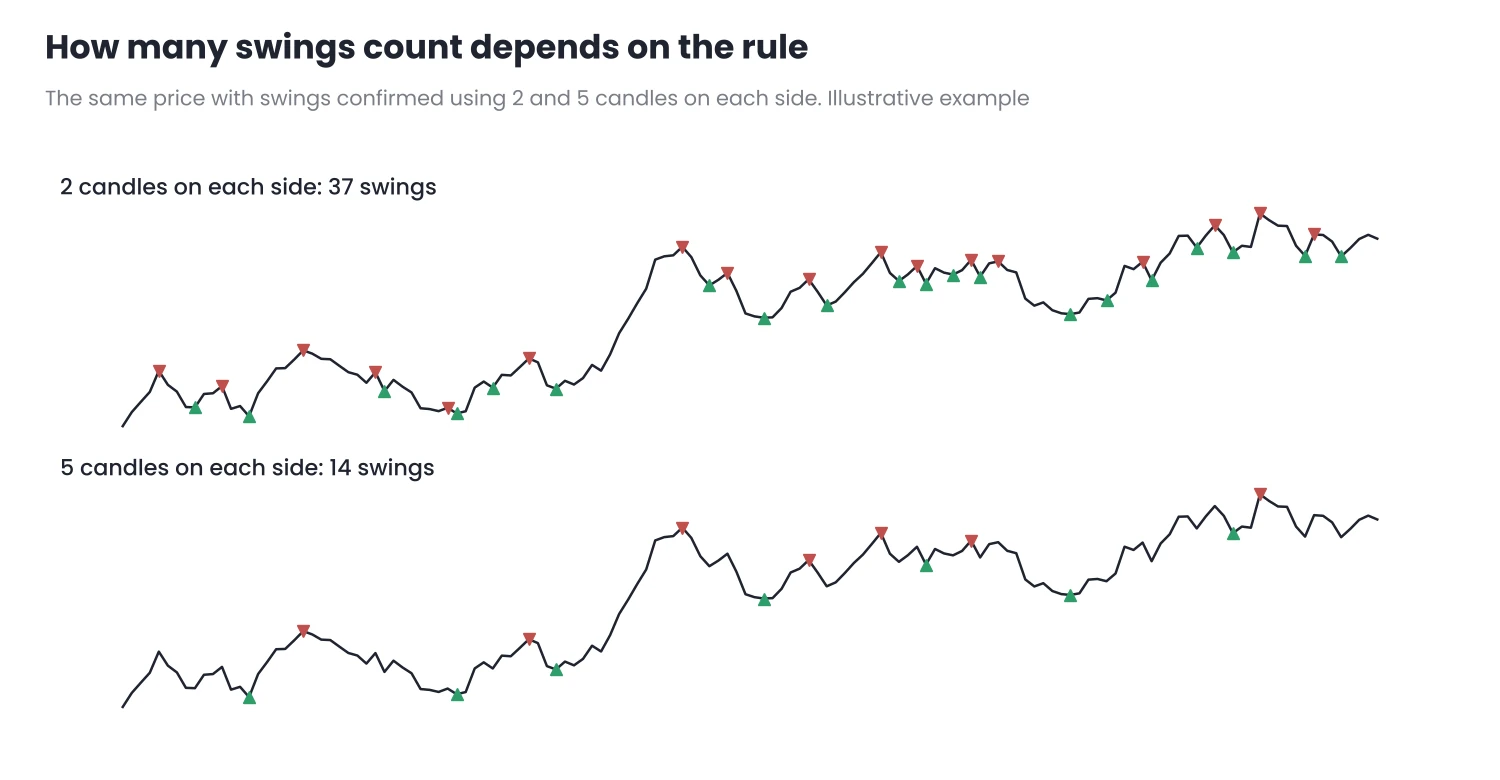
Figure 1. With 2 candles on each side many swings appear; with 5, only those that define the trend.
What matters is not the value of N, but always using the same one. And keep in mind that a swing is only confirmed N candles later: the latest high or low on the chart can still change.
3. When a trend is broken
Once swings are defined, a change of trend can be defined too. In an uptrend:
- First warning: a high forms below the previous one. The trend is losing strength, but it is still intact.
- Break: the price closes below the last higher low. The bullish sequence is broken.
- New downtrend: a high and a low form below the previous ones.
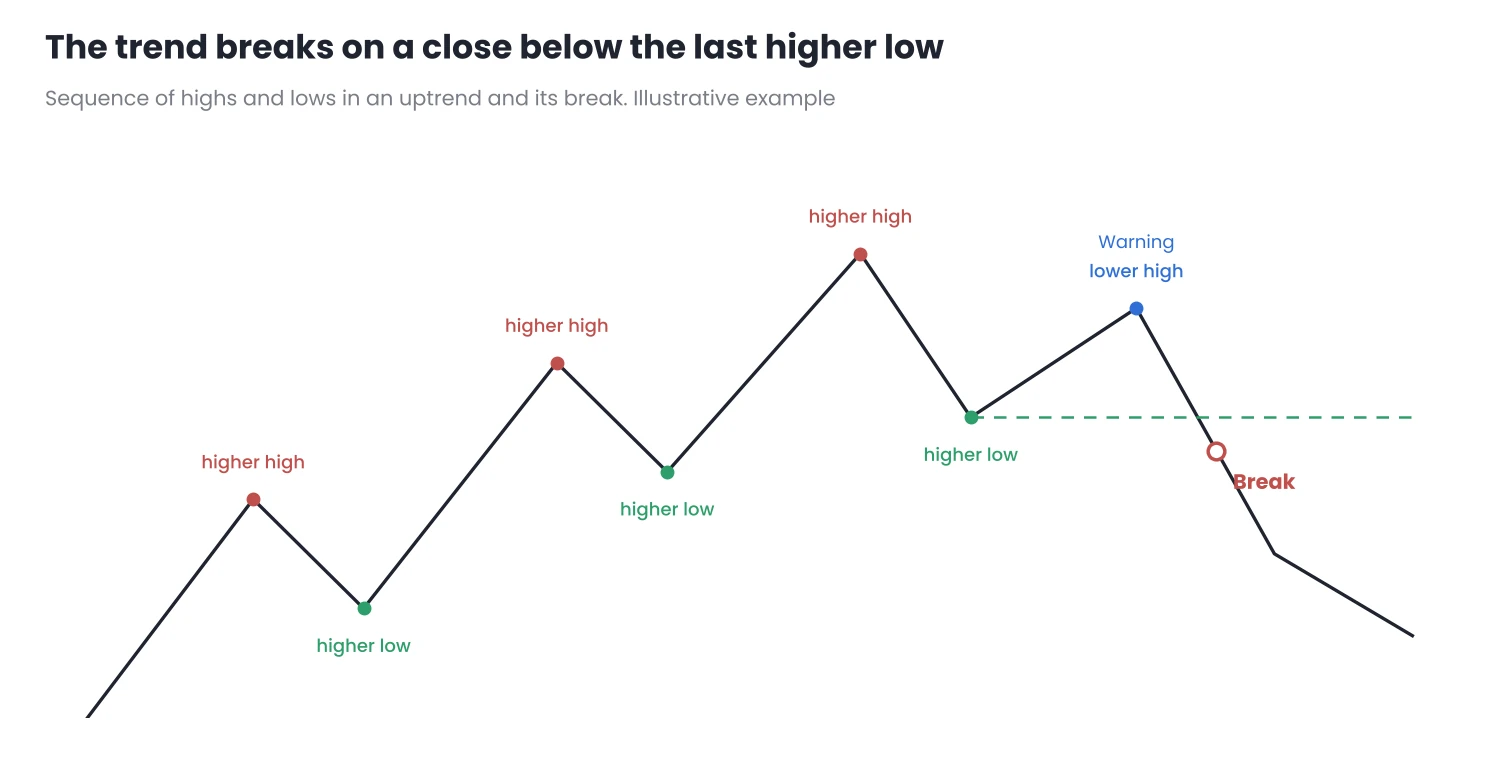
Figure 2. The uptrend breaks when the price closes below the last higher low.
Between the break and the new downtrend there is usually a phase with no clear direction. Treating it as a range, rather than as the immediate start of an opposite trend, avoids many hasty entries.
4. Each timeframe has its own trend
The same asset can be in an uptrend on the daily chart and in a downtrend on H1: a pullback on the daily chart is a complete downtrend on a lower timeframe. Neither reading is wrong. What you need is to decide in your plan which timeframe defines the trend you follow and which one you use to enter.
5. How to mark it the same way every time in MT5
- Choose a timeframe and a value of N and write them in your plan.
- Use the same price for swings: either wicks or closes. Mixing them changes the reading.
- Mark only the last two highs and lows. You do not need more to know whether the trend is still in place.
- Define the break as a close, not a touch, so that you do not react to a wick.
To mark swings, levels and zones quickly, you can use SnapDraw, a drawing panel for MT5. It only draws on the chart: it does not open or close trades or give signals.
Conclusion
- A trend is a sequence of highs and lows, rising or falling. If there is no sequence, it is a range.
- The definition depends on which swing counts. Choose a rule, such as confirmed swings with N candles on each side, and do not change it.
- A trend breaks with a close beyond the last relevant low or high. A lower high is only a warning.
Before your next trade, mark the last two highs and lows on the timeframe in your plan and check whether the sequence is still in place.
Want to bring this to your chart?
Jasopex tools for MetaTrader help you plan your risk before you trade.
See the tools