

ATR from Scratch (4/6): Comparing Assets with ATR as a Percentage
Fourth episode of the ATR series: why you cannot compare an index's ATR with a currency pair's in points, how to convert it to a percentage of the price and what that comparison is for.
In episode 3 we compared an asset’s ATR with its own history. Now we will compare different assets with each other: does DE40 move more than EURUSD? Gold or an index? It sounds like a simple question, but if you answer it by looking at ATR as it is, the answer is almost always wrong.
1. Why points cannot be compared
ATR is expressed in each asset’s own units. A daily ATR of 300 points on an index trading at 20,000 and an ATR of 66 pips on EURUSD, trading at 1.1000, cannot be put side by side: they are different units on very different prices.
It is like comparing two tips without knowing the size of the bill. Leaving €5 on a €20 meal is a lot; on a €200 one, it is little. The amount only means something when compared with the total.
2. ATR as a percentage of the price
The solution is to express ATR as a percentage of the price:
ATR % = ATR ÷ price × 100
| Asset | Price | Daily ATR | ATR % |
|---|---|---|---|
| Index | 20,000 | 300 points | 1.5% |
| EURUSD | 1.1000 | 0.0066 (66 pips) | 0.6% |
| Gold | 2,500 | 37.5 | 1.5% |
| Cryptoasset | 60,000 | 2,400 | 4.0% |
Illustrative values.
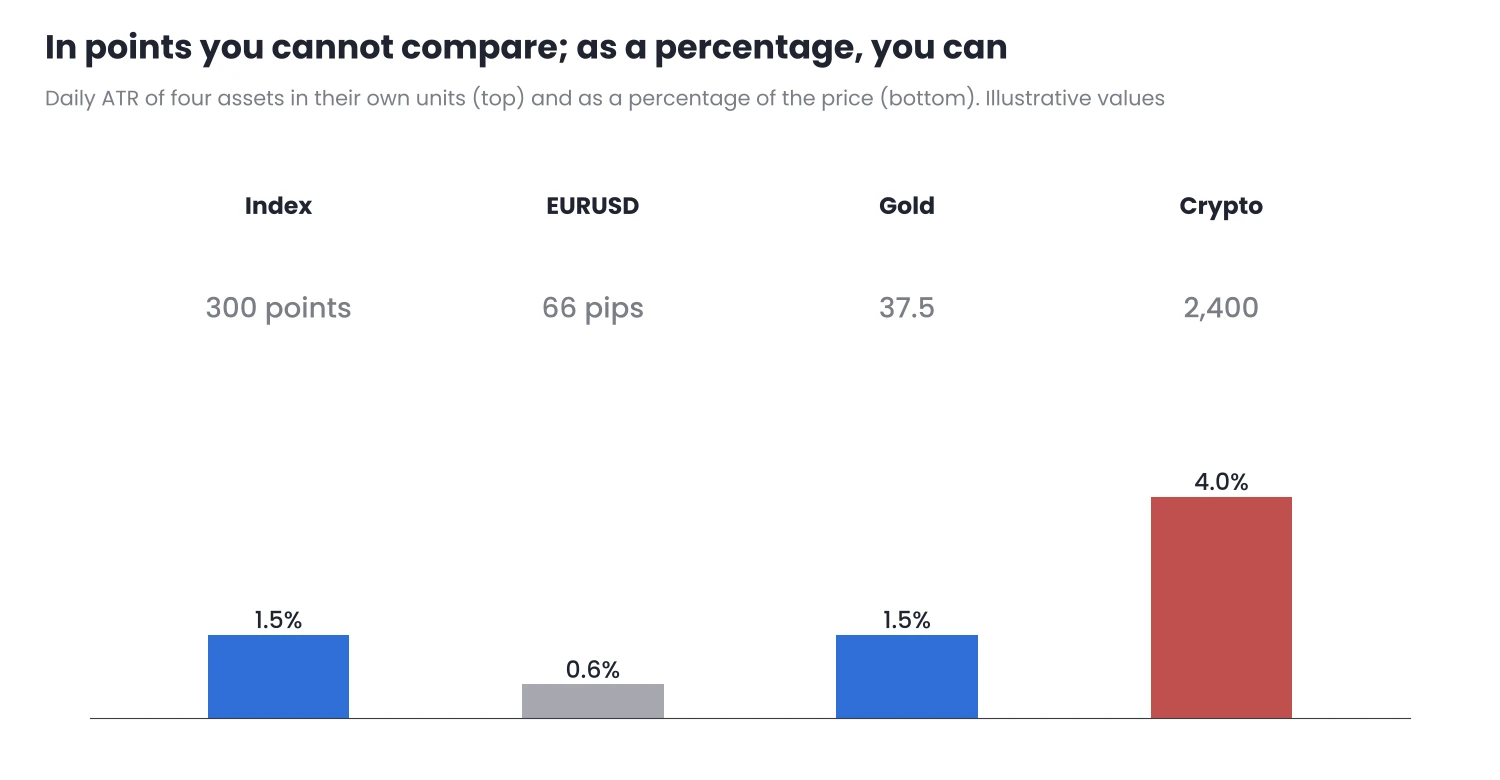
Figure 1. In points, the figures cannot be compared; as a percentage, you can see which asset moves more relative to its price.
With ATR as a percentage, the comparison makes sense: in this example, the index and gold move roughly the same relative to their price, EURUSD quite a bit less and the cryptoasset much more.
3. The percentage also works over time
There is another advantage. If an asset doubles in price over a few years, its ATR in points usually grows too, even if the asset is not more volatile in proportion. An ATR of 150 points when the index was at 10,000 and one of 300 when it is at 20,000 represent the same 1.5%.
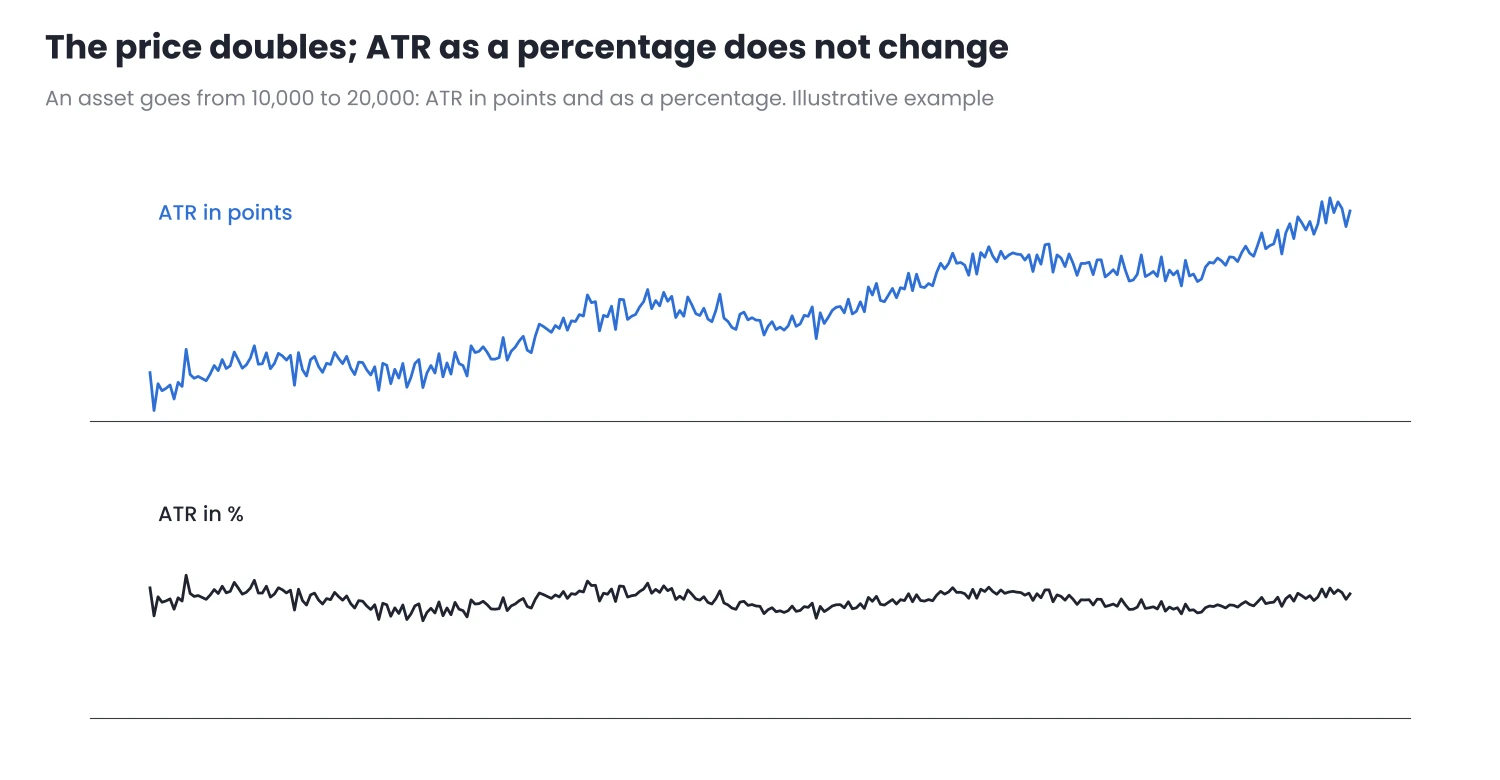
Figure 2. If the price doubles, so does ATR in points. ATR as a percentage shows that relative volatility has not changed.
That is why, when you compare current volatility with that of years ago, as in episode 3, it is best to do it as a percentage.
4. What comparing assets is for
- Choosing what to trade. Knowing which assets on your list move more in proportion helps you decide where there is room to move. I applied this in What to Trade Today.
- Setting expectations. A strategy that works on an asset with a 1.5% ATR may run out of room on one with 0.6%, or be too jumpy on one with 4%.
- Spreading risk. If you trade several assets, knowing their relative volatility helps ensure none of them dominates the result.
5. What the percentage does not tell you
- It does not include costs. An asset with a good ATR percentage can have a high spread relative to its movement.
- It is not for calculating the lot size. For that you need the value of each point in your account, which depends on the contract size and the currency. We will see this in episode 5.
- It needs the same timeframe and the same period. Comparing one asset’s daily ATR with another’s four-hour ATR mixes different things again.
6. In MetaTrader
- Neither MT4 nor MT5 shows ATR as a percentage with the standard indicator. You can calculate it by hand: divide the ATR value by the current price and multiply by 100.
- Use the same period and the same timeframe for all the assets you compare.
- In MT5, ATR Volatility Monitor shows ATR as a percentage of the price directly, alongside the value in price and points. It does not open or close trades or give signals.
Conclusion
- ATR in points cannot be compared between assets: each has its own units and price level.
- ATR as a percentage of the price can, and it also lets you compare different periods of the same asset.
- It helps you choose assets and set expectations, but it does not replace the lot size calculation, which needs the value of each point.
In episode 5 we will use everything so far for the most practical part: where to put the stop and how many lots to open.
Want to bring this to your chart?
Jasopex tools for MetaTrader help you plan your risk before you trade.
See the tools