

What to Trade Today: Liquidity, Volatility and Catalysts
How to choose each day which assets on your list to trade: cost against movement, current volatility against normal, calendar catalysts and a ten-minute routine in MT5.
A good method applied to the wrong asset delivers little. One day DE40 moves strongly and EURUSD barely moves; another day it is the other way round. Always trading the same thing, without looking at the state of each market, means often entering when there is not enough movement or when costs eat into the trade. This article explains how to choose each day which assets on your list deserve your attention.
1. First, a short, fixed list
The daily choice is made within a list that is already in your plan, not among every symbol in Market Watch. Three to six assets is usually enough: you know them, you know how they move during your hours and you have their costs under control.
What you decide each day is not which new asset to try, but which ones on your list are in a condition to be traded today.
2. Cost against movement
A spread that looks small can be large if the asset moves little. The way to compare it is to measure it against the typical move of the candle you trade on:
Relative cost = spread ÷ ATR of the entry timeframe
| Asset | Spread | H1 ATR | Relative cost |
|---|---|---|---|
| DE40 | 1.2 points | 35 points | 3.4% |
| XAUUSD | 0.30 | 5.00 | 6% |
| EURUSD | 1.0 pip | 7 pips | 14.3% |
| Exotic pair | 80 pips | 400 pips | 20% |
Illustrative values. Spread and ATR change with the broker, the hour and the day.
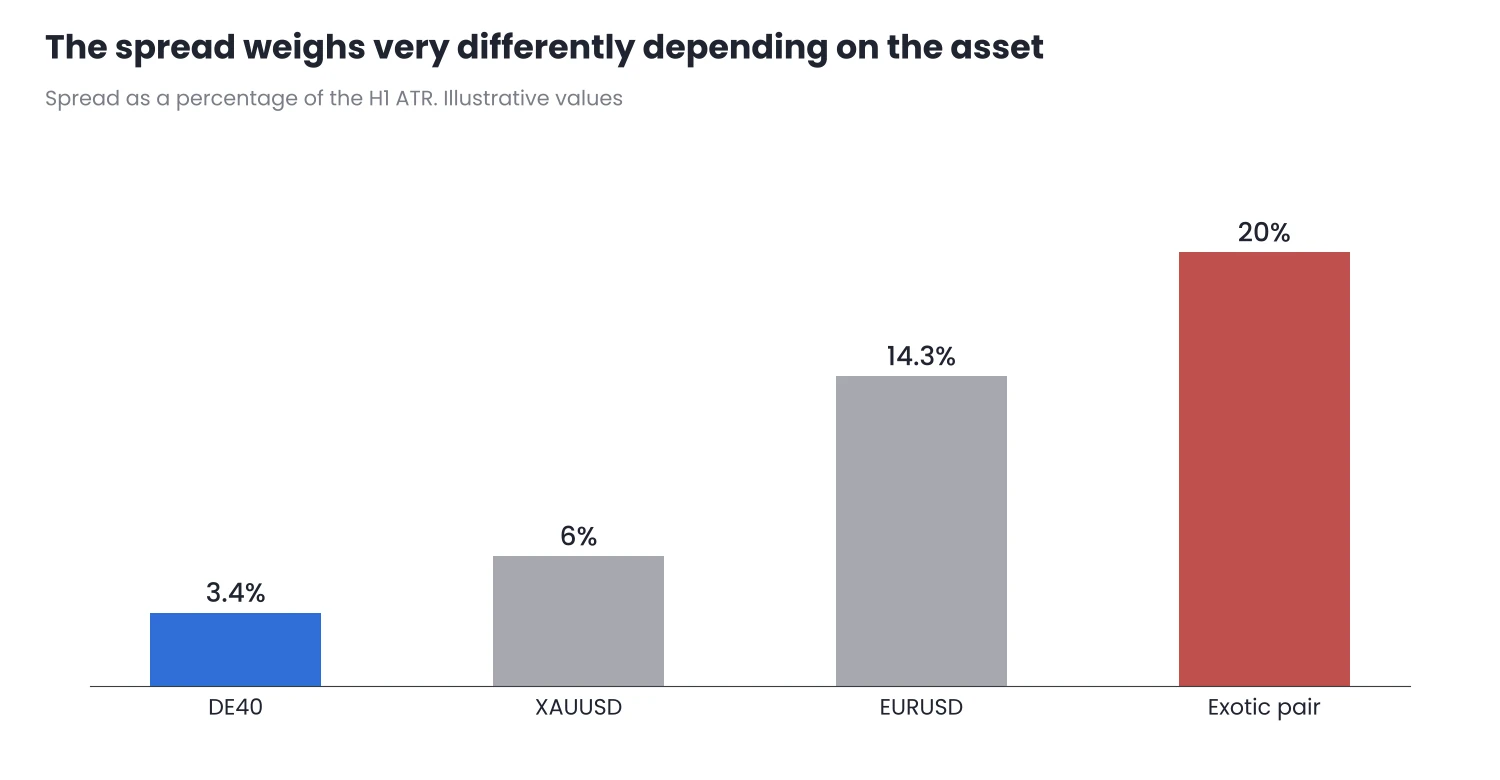
Figure 1. The same method pays far more in costs on one asset than on another.
The higher the relative cost, the further the price has to move in your favour just to cover the entry. If during your hours one asset has a much higher relative cost than the others, it may not be the time to trade it, even if it is on your list.
3. Today’s volatility against normal
The second filter is to compare each asset’s current volatility with its normal level:
Relative volatility = current ATR ÷ average ATR of the last few weeks
- Below 0.8: the asset is quieter than usual. Targets take longer to reach and costs weigh more.
- Between 0.8 and 1.5: normal or slightly higher volatility. This is where your method has usually been tested.
- Above 1.5: the asset is moving much more than usual. There are opportunities, but also stops hit by noise and more slippage. If you trade, the stop needs more room and the lot must be smaller to keep the same risk.
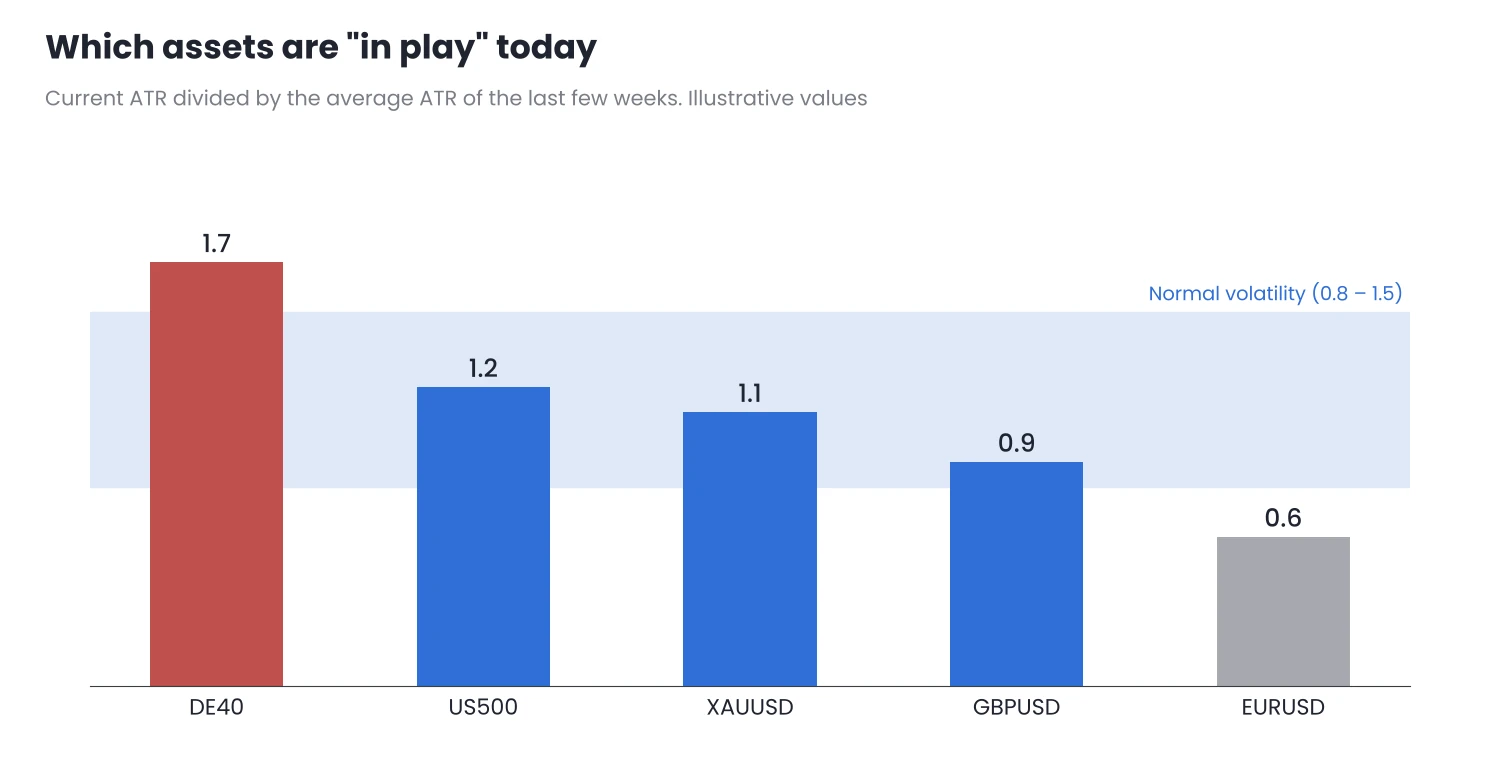
Figure 2. Comparing current ATR with the usual level shows which assets are “in play” today.
The thresholds are indicative: what matters is always applying the same ones. ATR Volatility Monitor tells you whether the asset’s volatility is high, normal or low compared with usual, and Zone Risk Planner includes a scanner to review several symbols at once. Neither of them opens or closes trades or gives signals.
4. The day’s catalysts
An asset can be quiet early in the day and move strongly in the afternoon because of a data release or a news item. Before the session, check the economic calendar for:
- Central bank decisions and inflation or employment data for the currencies in your pairs.
- Releases that affect indices, such as US data at 8:30 New York time, which also moves DE40.
- Holidays in the reference markets, which reduce liquidity even if the CFD is quoted.
Your plan should say what you do with them: avoid trading in the minutes around the release, close beforehand or, if your method allows it, trade the reaction. What you should avoid is discovering the release with a trade open. I cover session hours in Market Sessions and Server Time in MT5.
5. A ten-minute routine in MT5
- Open your asset list in Market Watch and check the current spread of each one.
- Compare their current ATR with the usual level and note which are below, within or above their normal volatility.
- Check the day’s calendar and mark the times of the releases that affect your assets.
- Check correlation: if you choose three pairs that depend on the dollar, you really have a single idea. I explain this in Total Open Risk and a Monthly Loss Limit.
- Choose one or two assets for the session and leave the rest out, even if they are on your list.
Common mistakes
- Chasing the asset that moved most yesterday. Volatility tends to persist, but not always, and you often arrive late.
- Adding new assets because “they are moving”. If it is not in your plan, you do not know how it behaves during your hours or how much it costs.
- Ignoring costs on quiet days. With low volatility, the spread weighs more on every trade.
- Watching too many assets at once. More screens do not bring more good opportunities; they bring more doubtful trades.
Conclusion
- The daily choice is made within a short, fixed list, not among every available symbol.
- Two numbers help you choose: relative cost (spread against ATR) and relative volatility (current ATR against normal).
- The calendar completes the decision. Knowing when each release arrives keeps you from discovering it with a trade open.
Try the routine for a week before each session and record in your journal which assets you chose and why. Do it first on a demo account.
Want to bring this to your chart?
Jasopex tools for MetaTrader help you plan your risk before you trade.
See the tools