

ATR from Scratch (3/6): A Lot or a Little? Comparing ATR with Its Own History
Third episode of the ATR series: why a single value says nothing, how to tell whether current volatility is high, normal or low for that asset and what changes in your trades in each case.
In episode 2 we saw where the ATR number comes from. Now comes the question everyone asks when they look at it: is this a lot or a little? The short answer is that, on its own, you cannot tell. An ATR of 40 points can be a quiet session for one asset and a nervy day for another. This episode explains how to give it context.
1. A number without context says nothing
Think about temperature. Thirty degrees in January in Madrid would be extraordinary; in August, a normal day. The number is the same, but what it means depends on what is usual for that place and time of year.
ATR works the same way. Suppose three assets with the same ATR of 40 on the one-hour chart:
| Asset | Current ATR | Usual ATR | Ratio |
|---|---|---|---|
| A | 40 | 25 | 1.6: much busier than normal |
| B | 40 | 40 | 1.0: a normal day |
| C | 40 | 60 | 0.67: quieter than normal |
Illustrative example.
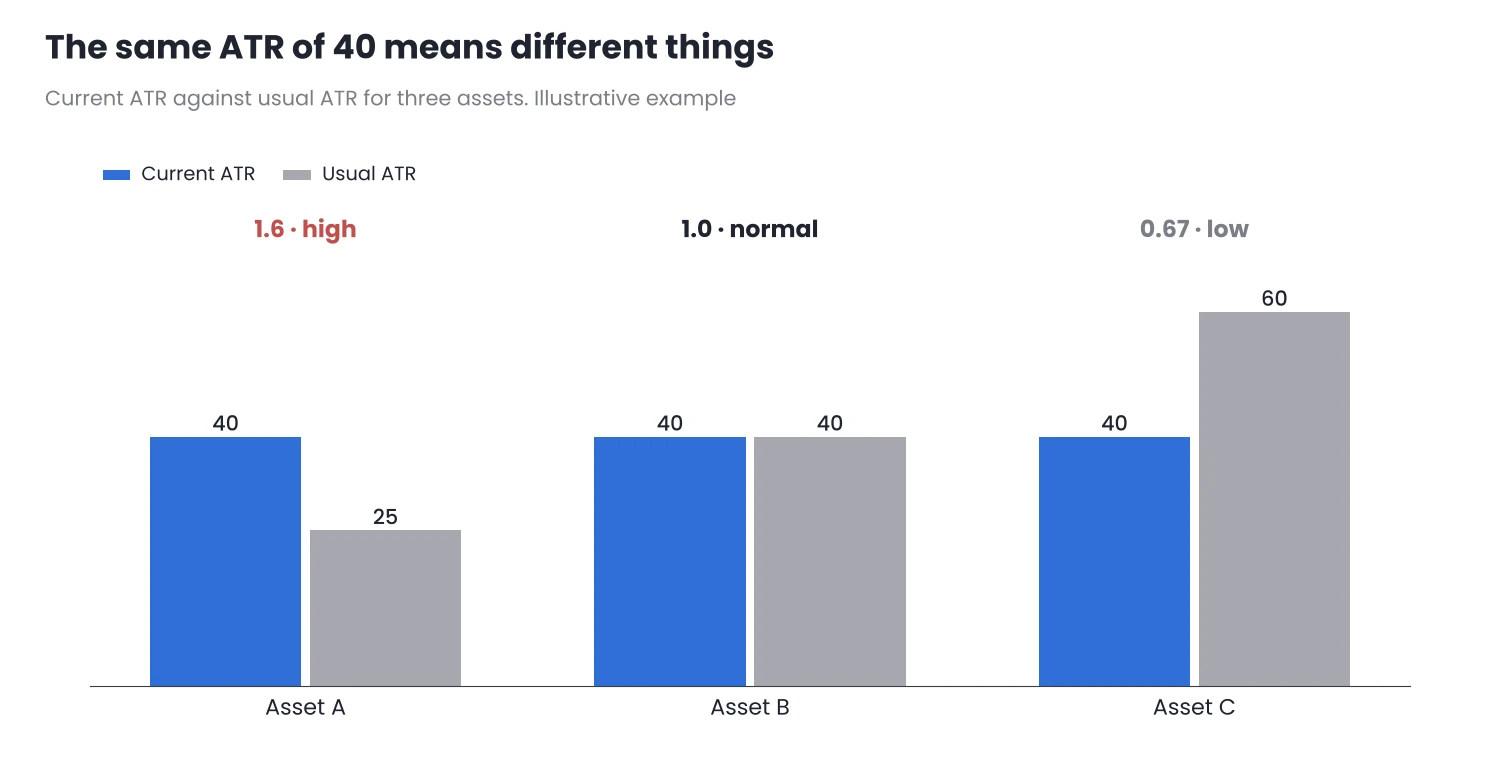
Figure 1. The same ATR of 40 is high for A, normal for B and low for C.
2. How to know what is “usual”
There are two simple ways to compare ATR with its own history.
Compare a short ATR with a long one
Use two ATRs on the same timeframe: a short one, reflecting the current moment, and a long one, reflecting background volatility. For example, a 14-period ATR and a 100-period one.
Relative volatility = short ATR ÷ long ATR
- Below 0.8: the asset is quieter than usual.
- Between 0.8 and 1.5: usual volatility.
- Above 1.5: much busier than usual.
The thresholds are indicative. I used the same idea to choose which asset to trade each day in What to Trade Today.
See where ATR sits within its history
The second way is to look at ATR over the last few months and see where the current value falls. If today’s ATR is higher than 80% of the values over the past year, volatility is high for that asset. If it is lower than 80% of them, it is low.
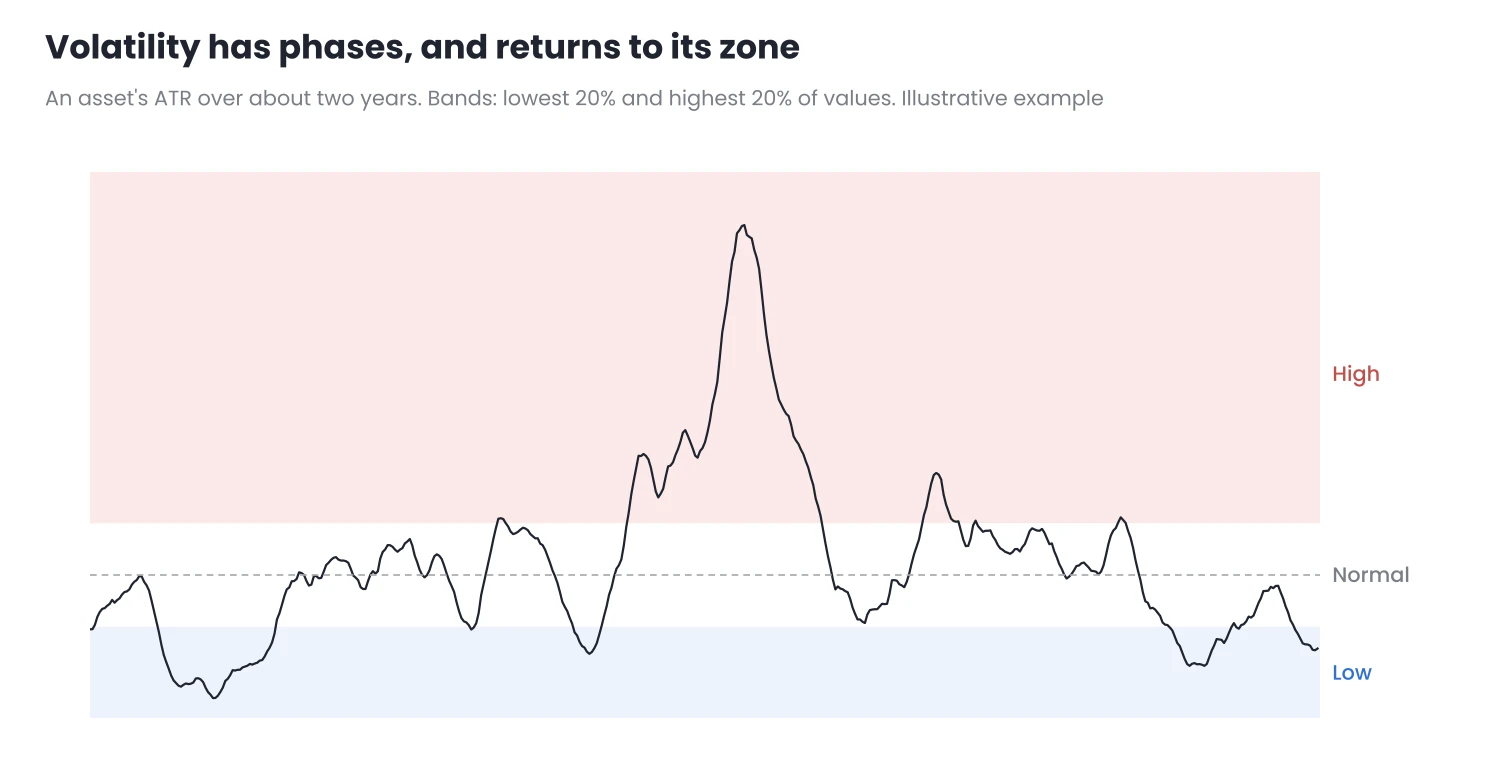
Figure 2. Volatility is not spread evenly: there are quiet periods and turbulent ones, and ATR tends to return to its usual zone.
3. Volatility clusters
Figure 2 shows two well-known features of volatility:
- It clusters. Busy days tend to be followed by more busy days, and quiet days by more quiet days. Today’s volatility gives clues about tomorrow’s, although not about the direction of the price.
- It tends to return to normal. Periods of very high or very low volatility do not last forever. Over time, ATR usually goes back to its usual zone.
That is why it makes sense to adjust how you trade to the level of volatility, rather than always trading the same way.
4. What changes in each case
| Volatility | What usually happens | What to adjust |
|---|---|---|
| High | Large candles, more slippage, wider spreads at the peaks | Wider stop and smaller lot to risk the same; more distant targets |
| Normal | The conditions in which strategies are usually designed and tested | Trade according to the plan |
| Low | Short moves, costs weigh more | Closer targets; consider whether trading is worth it |
Indicative. Each strategy reacts differently to volatility.
We will see how to turn this into a specific stop distance and position size in episode 5.
5. In MetaTrader
- Two ATRs in the same window: add ATR with a short period and, on its window, another with a long period. It works the same in MT4 and MT5.
- See the history: zoom out on the chart to see several months of ATR and check whether the current value is in the upper, middle or lower part.
- In MT5, ATR Volatility Monitor does this comparison for you: it tells you whether the asset’s volatility is high, normal or low compared with usual. It does not open or close trades or give signals.
Conclusion
- An ATR value only makes sense compared with what is usual for that asset and that timeframe.
- Two simple ways to compare it: a short ATR against a long one, or where the current value sits within its history.
- Volatility clusters and tends to return to normal. Adjusting the stop, lot and targets to the level of volatility is more sensible than always trading the same way.
In episode 4 we will see how to compare the ATR of different assets, such as an index and a currency pair, without cheating.
Want to bring this to your chart?
Jasopex tools for MetaTrader help you plan your risk before you trade.
See the tools