

ATR from Scratch (2/6): How It Is Calculated and How to Choose the Period
Second episode of the ATR series: what the true range is and why it includes gaps, how it is averaged, what changes with the timeframe and why 14 periods is not a rule.
In episode 1 we saw that ATR measures how much the price moves, not where. In this one we will see where that number comes from. Understanding the calculation is not an academic exercise: it is what lets you know why ATR changes, why it is not the same on every platform and why the famous “14” does not have to be your period.
1. A candle’s range is not enough
The simplest way to measure how much the price moved in a candle is to subtract its low from its high. But that measure misses something: what happens between one candle’s close and the next one’s open.
Imagine a candle closes at 100 and the next opens at 104, after a news release or a weekend. That second candle reaches a high of 105 and a low of 103.5. Its range is only 1.5, but the price has moved 5 from the previous close. If you only look at the range, the gap disappears from the calculation.
2. The true range
Wilder solved this with the true range: the largest of these three values.
| Measure | What it captures | In the example |
|---|---|---|
| High − low | The move within the candle | 105 − 103.5 = 1.5 |
| High − previous close | A gap up | 105 − 100 = 5 |
| Previous close − low | A gap down | 100 − 103.5 = −3.5 (in absolute value, 3.5) |
| True range | The largest of the three | 5 |
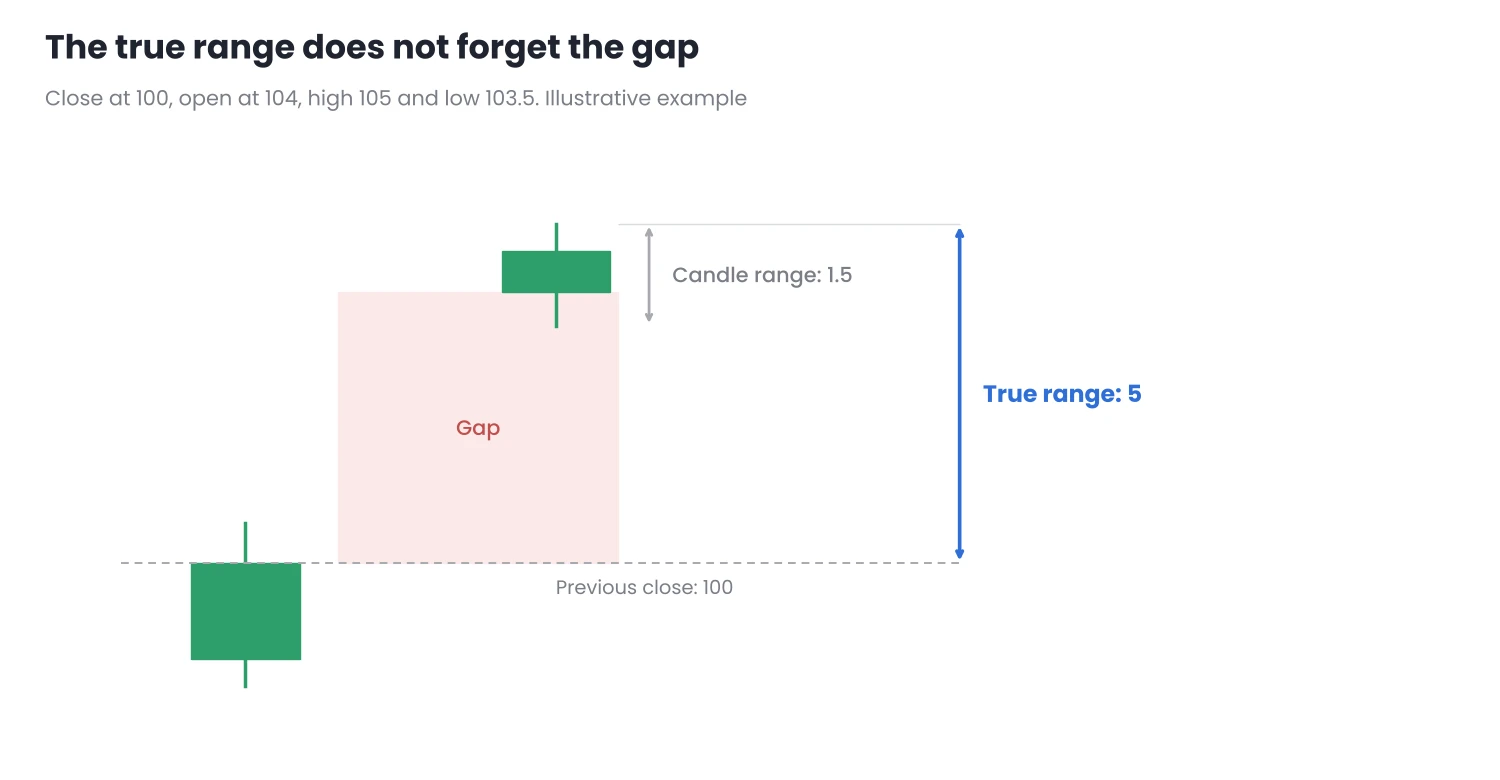
Figure 1. The true range counts the move from the previous close, gap included.
When there is no gap, the true range is the same as the candle’s normal range. It only changes when the price jumps from one candle to the next, which is exactly when it matters most.
3. The average: from single ranges to a useful value
A single true range says little: a candle can be large or small by chance. ATR averages the true ranges of the last N candles.
Jackie makes this easy for me. Some days her walk is long and some days short, depending on the weather or what she finds along the way. If I want to know how much she usually walks, I do not look at a single walk, but at the average of the recent ones. That average does not say where she will go tomorrow, but it does say how far she usually walks. And if one day she goes on a very long walk, the average rises a little, but it does not shoot up.
ATR works the same way: a very busy day raises the average, but does not change it all at once, because it is spread across all the candles in the period.
A technical detail: Wilder used his own smoothing, similar to an exponential average, and some platforms follow his method. The ATR included in MetaTrader calculates a simple average of the true ranges. That is why, with the same period, the value may differ slightly between platforms. It is not an error: it is a different way of averaging.
4. The timeframe changes the number
ATR is calculated on the candles of the chart you put it on. The ATR of one-hour candles and that of daily candles for the same asset are very different numbers: a daily candle captures the whole day’s move, which is much larger than any single hour’s.
That is why, when someone says “put the stop at 2 ATR”, the first question is: ATR on which timeframe? 2 ATR on M15 is not the same as 2 ATR on D1.
5. The period: 14 is not a rule
Wilder used 14 periods, and almost every platform has it as the default. But it is a convention, not an optimal value. In many strategies, especially short-term ones, another period fits better.
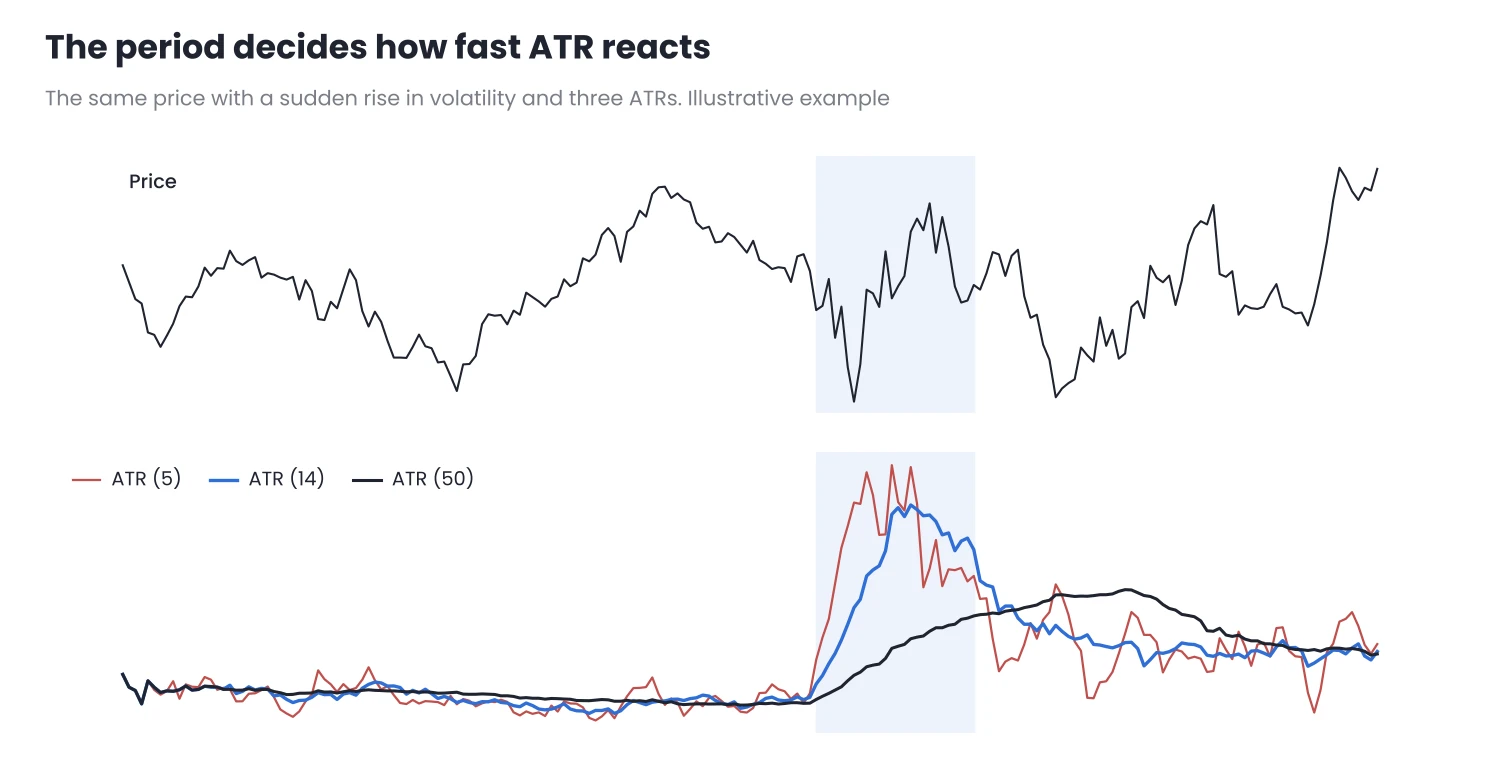
Figure 2. Faced with a sudden rise in volatility, the 5-period ATR reacts straight away, the 14 takes a little longer and the 50 barely changes.
- Short period (for example, 5 to 10): reacts fast to changes in volatility. Useful when what matters is what is happening now, as in intraday trading, but it gives a jumpier value.
- Medium period (for example, 14 to 20): a balance between reaction and stability. That is why it works as a default.
- Long period (for example, 50 or more): very stable. Useful for knowing an asset’s background volatility or comparing periods.
| What you use it for | Indicative period |
|---|---|
| Stop on trades lasting a few hours | Short, on the entry timeframe |
| Stop and position size on trades lasting several days | Medium, on the daily chart |
| Knowing whether current volatility is high or low | Long, as a reference |
| Measuring the day’s range | Daily ATR over a few days to a few weeks |
Indicative values. It is worth testing two or three periods on your asset and sticking with one.
What matters is not finding a magic number, but choosing it according to its use, testing it and keeping it. Changing the period every week is like changing scales every time you do not like your weight.
6. In MetaTrader
- The parameter is called Period and it is the only one ATR has, in both MT4 and MT5.
- You can add several ATRs with different periods in the same window to compare them, as in figure 2.
- If you compare with another platform, remember that MetaTrader uses a simple average and others use Wilder’s smoothing: with the same period, values may differ slightly.
Conclusion
- The true range includes gaps: it is the largest of the candle’s range and the distance to the previous close.
- ATR is the average of those ranges over the chosen period, on the chart’s timeframe.
- 14 is the default, not a rule. Choose the period according to what you use it for, and keep it.
In episode 3 we will see how to tell whether an ATR value is a lot or a little for your asset.
Want to bring this to your chart?
Jasopex tools for MetaTrader help you plan your risk before you trade.
See the tools