

ATR from Scratch (1/6): What It Measures and Why It Matters
First episode of the ATR series: what it is, what it measures and what it does not, how to read its value and why it sits behind almost every risk decision.
Almost everyone who trades has seen ATR at some point. It is on every platform and appears in almost every course. But ATR is like the ring pull on a drinks can: we all know it is there, but few know that if you turn it round it holds the straw in place. It gets seen, used out of habit and barely put to work.
This series aims to change that. In six short episodes we will look at what ATR measures, how it is calculated, how to tell whether its value is high or low, how to compare assets, how to use it for the stop and position size, and how to read the day’s range. This first episode covers the basics: what it is and why it matters so much.
1. What ATR is
ATR stands for Average True Range. J. Welles Wilder introduced it in 1978, and it measures how much the price moves, on average, in each candle.
Its value is expressed in the same units as the price: points on an index, pips on a currency pair or dollars on gold. If DE40’s ATR on the one-hour chart is 40 points, it means that, on average, that index’s one-hour candles have travelled about 40 points between their high and low.
We will see exactly how it is calculated, and why it is called the “true” range, in episode 2.
2. What it measures and what it does not
The simplest way to understand ATR is to think of a car’s speedometer. It tells you how fast you are going, but not where you are going. You can be doing 100 km/h north or south: the speedometer will show the same.
ATR works the same way:
- It measures the size of the move, not its direction.
- It rises in strong rallies and in strong sell-offs alike. In fact, in many markets it rises more in sell-offs, because they tend to be sharper.
- It does not say whether the price is expensive or cheap, or whether it is about to turn.
- It does not predict: it describes how the price has moved over the last few candles.
I have another example at home. Jackie, my little dog, loves barking at and greeting everyone who walks past. Her barking tells me there is movement in the street, and the busier it is, the more she barks. But it does not tell me who is passing or which way they are going. ATR is the same: it tells you how much the price is moving, not in which direction.
And there is an important difference from many other indicators: ATR gives no signals. An indicator that flags an entry on every candle is like getting up to open the door every time Jackie barks: you would spend the whole day doing nothing else. ATR does not tell you when to enter; it tells you how busy the street is, so you can make your decisions with that information.
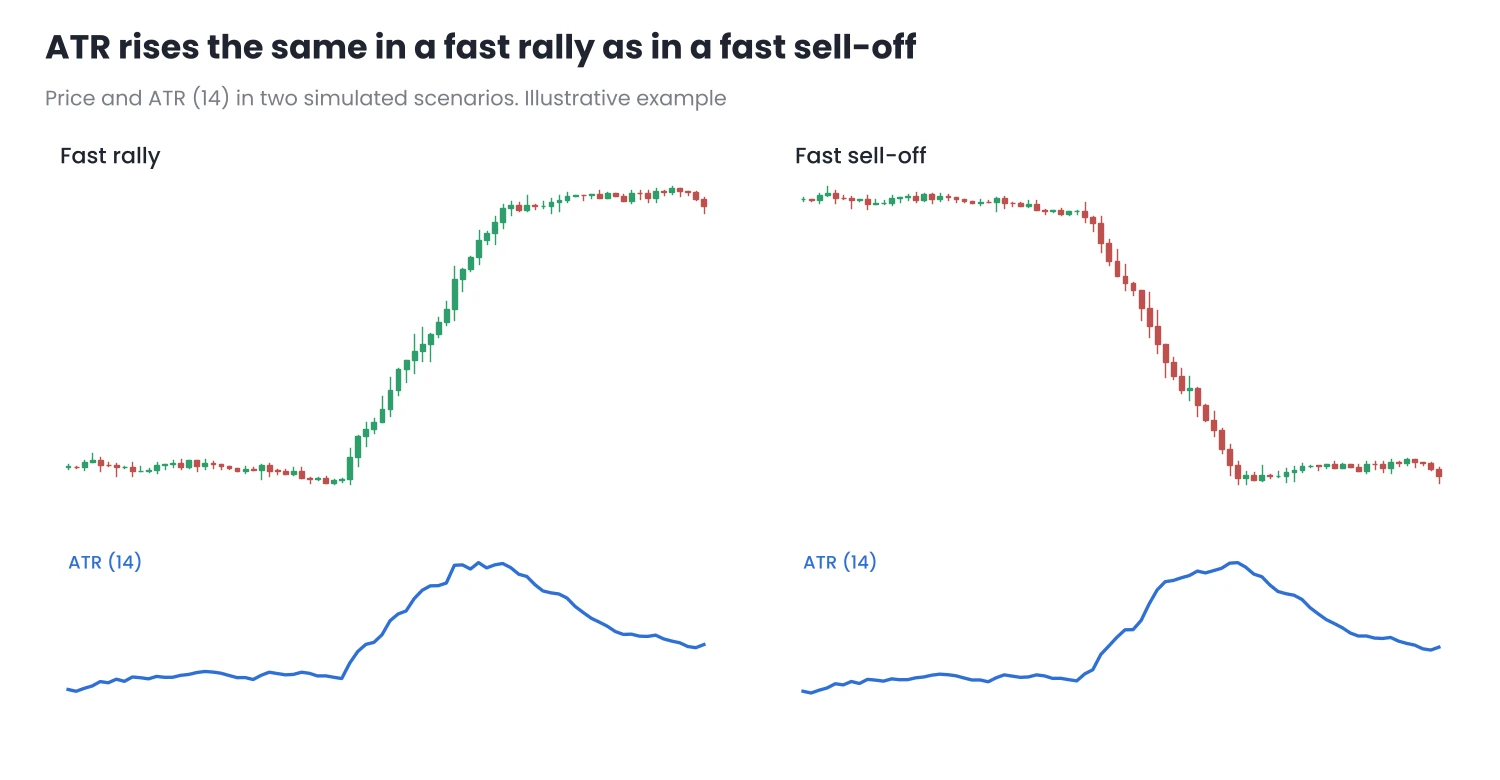
Figure 1. A rally and a sell-off of the same speed produce the same rise in ATR: it measures speed, not direction.
This is the most common beginner mistake: seeing ATR rise and thinking the price is going to rise. A rising ATR only says that candles are getting bigger.
3. How to read its value
The ATR figure only makes sense alongside three things:
- The asset. 40 points on DE40 and 40 pips on EURUSD are not comparable. We will see how to compare different assets in episode 4.
- The timeframe. The ATR of one-hour candles is much smaller than that of daily candles for the same asset.
- What is normal for that asset. An ATR of 40 can be a lot if 25 is usual, or little if 60 is usual. We will look at this in episode 3.
4. Why it matters so much
Almost every risk decision depends on one question: how much does this asset move? And that is exactly the question ATR answers.
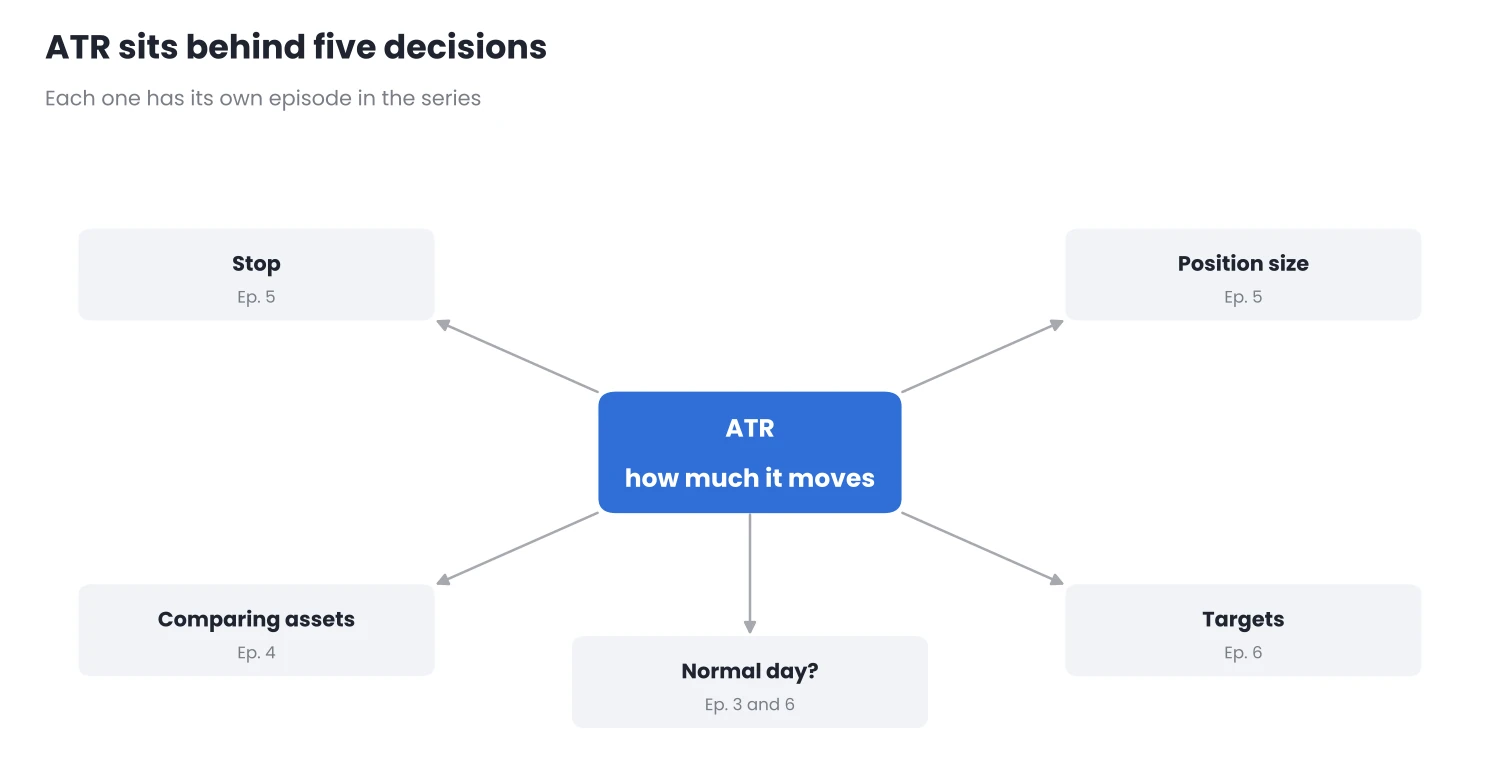
Figure 2. ATR sits behind five decisions in every trade. Each one has its own episode in the series.
- Where to place the stop. A stop smaller than the asset’s normal movement gets hit by pure noise.
- How many lots to open. With a wider stop, the lot has to be smaller to risk the same amount.
- Which targets are realistic. There is no point expecting five times the normal movement in a single session.
- Comparing assets. Knowing which one moves more, relative to its price.
- Knowing whether the day is normal. If the session has already covered its usual range, there is less room ahead.
That is why ATR is not just another indicator. It gives no buy or sell signals, but it provides the measure by which almost everything else is calibrated.
5. Common beginner mistakes
- Reading ATR as a direction signal. It rises in sell-offs just as it does in rallies.
- Copying a “2 ATR stop” without understanding why. It works as a starting point, but you need to know what it means for your asset and timeframe.
- Assuming 14 is the right period. It is only the default; depending on the strategy and timeframe, another one may suit better. We cover this in episode 2.
- Comparing two assets’ ATR in points. You need to convert it to a percentage of the price.
6. In MetaTrader
- Where it is: Insert → Indicators → Oscillators → Average True Range, in both MT4 and MT5. It is drawn in a window below the chart.
- How to read the value: the figure appears in the corner of its window. You can also open the Data Window (Ctrl + D) and hover over any candle to see its ATR.
- In MT5, ATR Volatility Monitor shows the asset’s ATR in price, points and percentage, and tells you whether volatility is high, normal or low. It does not open or close trades or give signals.
Coming up in the series
- What it measures and why it matters (this episode).
- How it is calculated: the true range, gaps and how to choose the period.
- A lot or a little? Comparing ATR with its own history.
- Comparing assets: ATR as a percentage of the price.
- The stop and the lot: how much room to give and how much to open.
- The day’s range: how much room the session has left.
Conclusion
- ATR measures how much the price moves, not where. It is a speedometer, not a compass.
- Its value depends on the asset, the timeframe and what is normal for that asset.
- It matters because it answers the question almost every risk decision depends on: how much does this move?
Before the next episode, add ATR to a chart you trade regularly and look at its value on different timeframes. In episode 2 we will see where that number comes from.
Want to bring this to your chart?
Jasopex tools for MetaTrader help you plan your risk before you trade.
See the tools