

ATR from Scratch (6/6): The Day's Range and How Much Room Is Left
Last episode of the ATR series: how to measure how much of its usual range the session has already covered, what that means for entries and targets, and a summary of everything we have seen.
We close the series with a use of ATR that many people do not know and that is very practical: knowing how much the day has already moved and how much it usually has left. In episode 5 we used ATR for the stop and the lot size. Now we will use it to decide whether it is worth entering at a given time and what target is reasonable.
1. The daily ATR as the session’s “range”
If your car usually does about 600 kilometres on a full tank and you have already driven 550, you do not plan another 300-kilometre trip without refuelling. The car might go a bit further, but that is not normal.
The daily ATR works like that range: it tells you how far the price usually travels in a day. By comparing today’s move with that value, you know how much of the “tank” the session has already used.
Range used = (today’s high − today’s low) ÷ daily ATR × 100
2. An example
An index has a daily ATR of 300 points. Halfway through the session, the day has a high of 20,240 and a low of 20,000:
| Value | |
|---|---|
| Daily ATR | 300 points |
| Today’s range so far | 240 points |
| Range used | 80% |
| Usual remaining move | about 60 points |
Illustrative example.
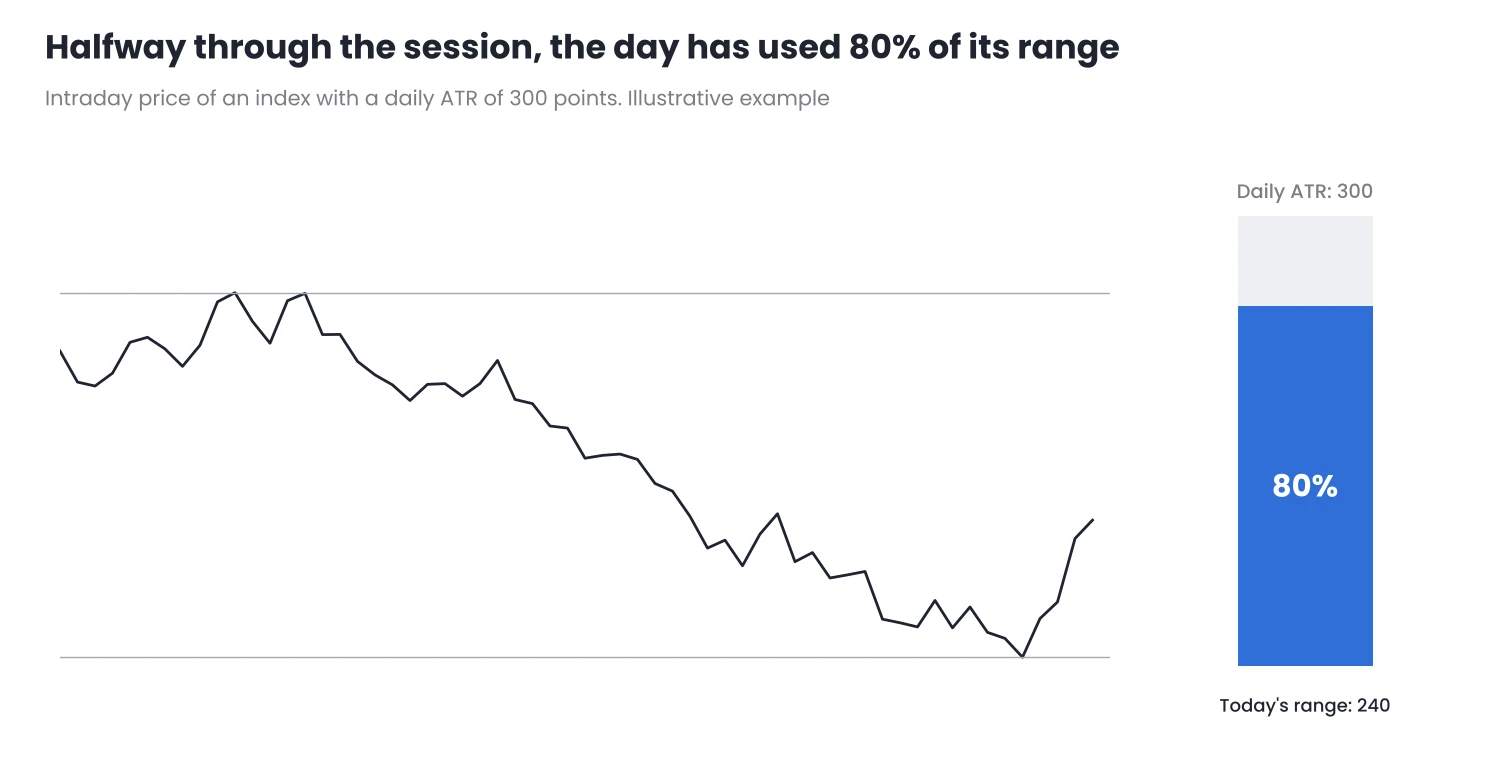
Figure 1. Halfway through the session, the day has already covered 80% of its usual range.
With 80% used, looking for a 150-point target from here would mean expecting a very unusual day. It is not impossible, but it should not be what you expect by default.
3. What to do with this information
- Late entries. If the day has already used most of its range, a new entry has less room ahead. It may make sense to wait for another session or require a clearer reward-to-risk ratio.
- Realistic targets. A target that forces the day to travel much further than its ATR is unlikely. Fitting it to the remaining move avoids watching the price turn around halfway.
- Days that break the norm. Some days travel much more than their ATR, especially on news or in strong trends. That is why the range used is a reference, not a limit.
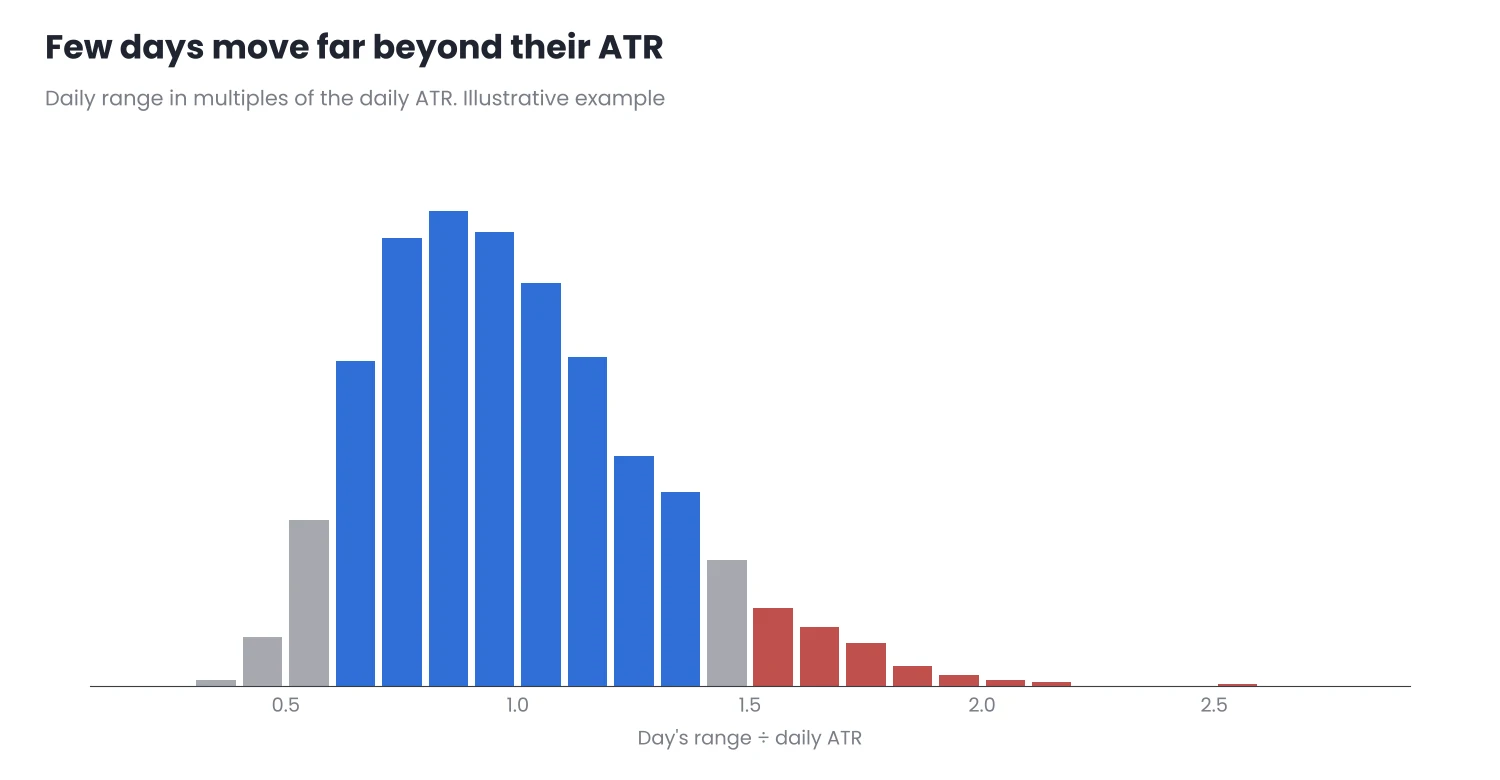
Figure 2. In this example, most days travel between 0.6 and 1.4 times their ATR, and few exceed 1.5 times. Measure it on your asset.
4. When “the day” starts and ends
The day’s range depends on when the daily candle starts and ends, and that is decided by your broker’s server time. If your broker closes the day at a different time from what you think, “today’s” high and low will not be the ones you expect. I explain this in Market Sessions and Server Time.
5. In MetaTrader
- The daily ATR: add ATR to a daily chart, or check its value in the Data Window (Ctrl + D) on yesterday’s candle. It works the same in MT4 and MT5.
- Today’s range: the high and low of the current daily candle. Subtract one from the other and divide by the daily ATR.
- The period: for this measure a daily ATR of a few days to a few weeks is usually enough, as we saw in episode 2.
What we have covered in the series
- What ATR measures and why it matters: how much the price moves, not where, and why it sits behind almost every risk decision.
- How it is calculated: the true range includes gaps, and 14 periods is only the default.
- A lot or a little?: an ATR only makes sense compared with what is usual for that asset.
- Comparing assets: ATR as a percentage of the price.
- The stop and the lot: a stop with room proportional to volatility and a lot size adjusted to always risk the same.
- The day’s range: how much the session has covered and how much it usually has left.
That is the ring pull put to proper use: ATR gives no signals, but understood well it helps you decide the stop, the size, the targets and even when to enter.
Conclusion
- The daily ATR works like the session’s range: comparing today’s move with it tells you how much room is usually left.
- Use it for late entries and realistic targets, knowing that some days break the norm.
- Check when the day starts and ends at your broker, because it changes the range you measure.
Over the next two weeks, note each day at what time your asset’s range exceeds 80% of its daily ATR. You will be surprised how much it tells you about when to stop looking for entries.
Want to bring this to your chart?
Jasopex tools for MetaTrader help you plan your risk before you trade.
See the tools