

The Economic Calendar: Which Releases Move Your Asset
How to read an economic calendar, which releases usually move indices, currencies and gold, why the surprise matters more than the figure, what happens to the spread and what to do with open positions.
Many trades are not lost because of bad analysis, but because of a release that arrived while the position was open and that nobody had checked. An economic calendar tells you in advance what is being published, when and how important it is. This article explains how to read one, which releases usually move each type of asset and how to prepare for them, whichever platform you trade on.
1. How to read an economic calendar
There are many calendars: your broker’s, those on financial websites and those built into some platforms. They all show the same for each event:
- Time and the country or currency it affects.
- Importance, usually low, medium or high.
- Previous figure, forecast and actual figure, the last one once released.
To make it useful you need to filter it:
- By importance: keep only high importance and, if you like, medium. Low-importance events rarely move the market meaningfully.
- By currency or country: only those that affect your assets. If you trade DE40 and EURUSD, you mainly care about the euro area and the US.
And before relying on the times, check which time zone your calendar uses by comparing a release whose time you know. If you also use a platform with server time, I explain the difference between the two in Market Sessions and Server Time.
2. Which releases usually move each asset
| Asset | Releases that usually move it | Usual time (CET) |
|---|---|---|
| US indices and DE40 | US employment, inflation (CPI), Federal Reserve decisions | 14:30 for data; 20:00 for the Fed |
| EURUSD | The above, plus ECB decisions and press conference and euro area inflation | 14:15 for the ECB; 11:00 for inflation |
| GBPUSD | Bank of England decisions, UK inflation and employment | 13:00 for the BoE; 8:00 for data |
| USDJPY | US data and Bank of Japan decisions | Variable |
| XAUUSD | US data, especially inflation, employment and the Fed | 14:30 and 20:00 |
Indicative times, outside the daylight saving transition weeks. Always check them in the calendar.
Beyond this table, earnings from the big tech companies often move US100 outside market hours, and holidays in the reference markets reduce liquidity even if the CFD is quoted.
3. What moves the price is the surprise
The market does not react to the figure itself, but to the difference from what was expected. That is why the calendar shows a forecast next to each event:
- Figure in line with the forecast: there is usually little movement, because it was already priced in.
- Figure very different from the forecast: this is when sharp moves appear.
- Revisions: sometimes the previous figure is corrected, and that correction weighs as much as the new figure.
That is why it makes no sense to try to guess the direction from the figure. What you can prepare is how you manage risk around it.
4. What happens at the moment of the release
In the seconds around a major release, three things happen at once:
- The spread widens, sometimes to several times its normal value.
- Liquidity drops, because many participants pull their orders.
- Stops can be filled further away from their level, with slippage. I explain this in Order Types and Slippage.
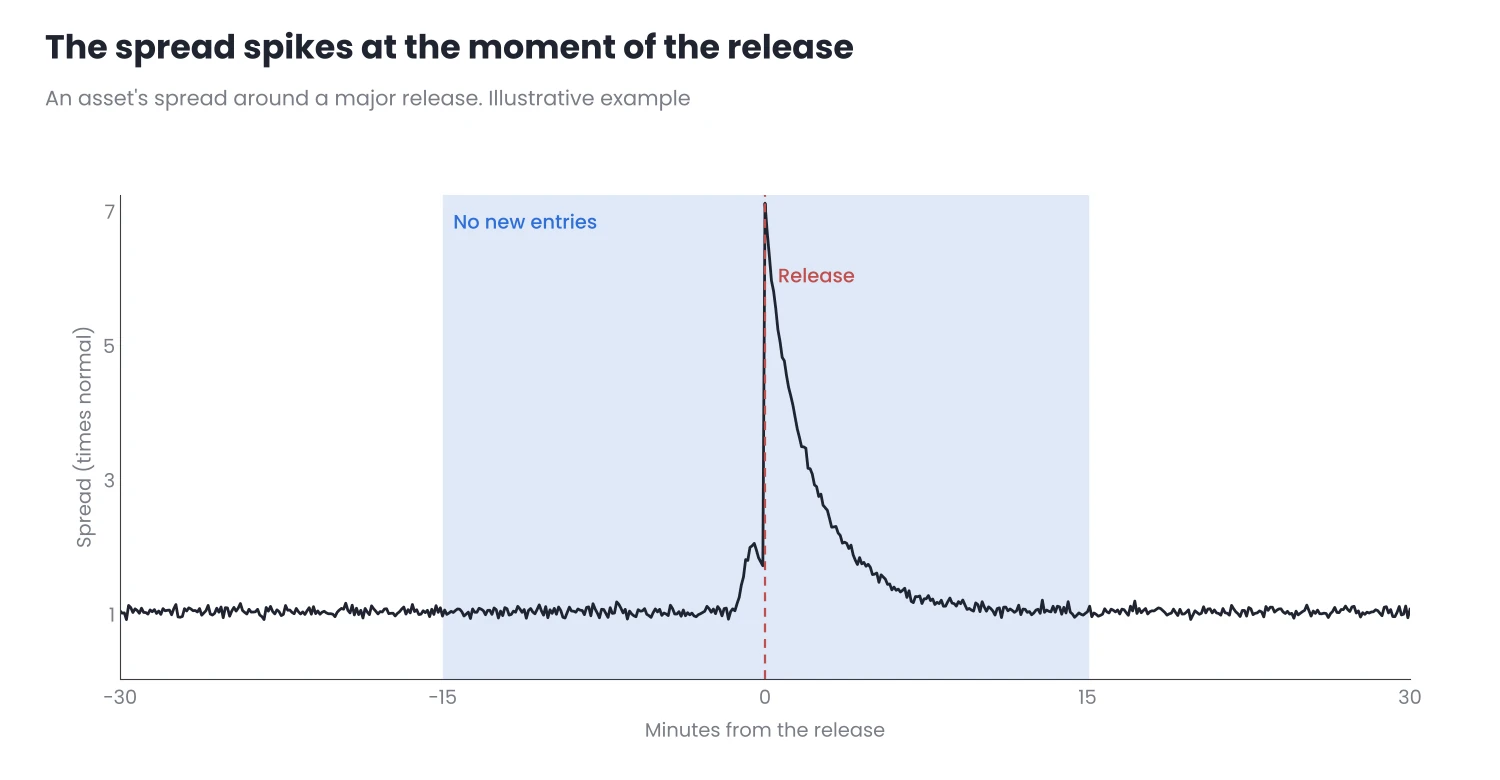
Figure 1. The spread spikes at the moment of the release and takes a few minutes to normalise.
5. What to do with your trades
The decision should be written in your trading plan before the release arrives. Some reasonable options:
- Do not open new trades in a window around the release, for example from 15 minutes before to 15 minutes after.
- Reduce or close open positions if the stop is close and slippage could turn the planned loss into a much larger one.
- Hold positions with a distant stop or already in profit, accepting that they may move sharply.
- Trade the reaction, only if your method is designed for it and tested in those conditions.
6. In MetaTrader
- MT5 has a built-in economic calendar, in the Calendar tab of the Toolbox. You can filter it by importance and currency, and in the chart properties you can have events displayed on the chart itself.
- MT4 does not include a calendar. You can use your broker’s or a financial website’s, taking care to check its time zone.
- After the release, volatility usually stays high for a while. ATR Volatility Monitor tells you whether the asset’s volatility is high, normal or low compared with usual, so you know when it returns to normal. It does not open or close trades or give signals.
A five-minute routine
- At the start of the week, review the calendar with the high-importance filter and note the releases for your assets.
- Each day, before trading, check the times of that day’s releases.
- With a position open, look at which releases arrive before your next review and decide according to your plan.
- After the release, wait for the spread to return to its normal level before entering.
Conclusion
- A calendar filtered by importance and currency tells you what is coming, when and what is expected.
- The price reacts to the surprise, not to the figure. It is not about guessing the direction, but about managing risk around the release.
- Decide in advance what you will do: no new trades in a window around the release, reduce what has a close stop or hold what has room.
This week, filter the calendar by your currencies and high importance, and record in your journal how your assets moved on each release. Do it first on a demo account.
Want to bring this to your chart?
Jasopex tools for MetaTrader help you plan your risk before you trade.
See the tools