

Price Targets: Projecting Patterns, Ranges and Channels
How to project a target from the height of a range, a pattern or a channel, how reliable it is, why to treat it as a zone and how to use it to decide whether a trade is worth taking.
Before entering a trade it is worth knowing where it could end. Not to hit the exact price, but to decide whether the potential profit is worth the risk. Projections from ranges, patterns and channels are a simple way to estimate that distance. This article explains how they are calculated, what you can expect from them and how to use them without giving them more precision than they have.
1. What a target is for
A target is not a promise from the market, but a reference for two decisions:
- Whether the trade is worth it. If there is less distance from entry to target than your plan requires relative to the stop, the trade is not worth taking.
- Where to manage the exit. Near the target you can close, close part of the position or tighten the stop, depending on what your plan says.
I explain the relationship between reward, risk and win rate in Risk/Reward vs Win Rate, on the MQL5 blog.
2. Three ways to project
The height of a range
When the price breaks out of a range, the most common projection is the height of the range itself, added from the breakout level:
Target = breakout level ± range height
If an index moves between 19,800 and 20,000 and breaks higher, the height is 200 points and the projection lands at 20,200.
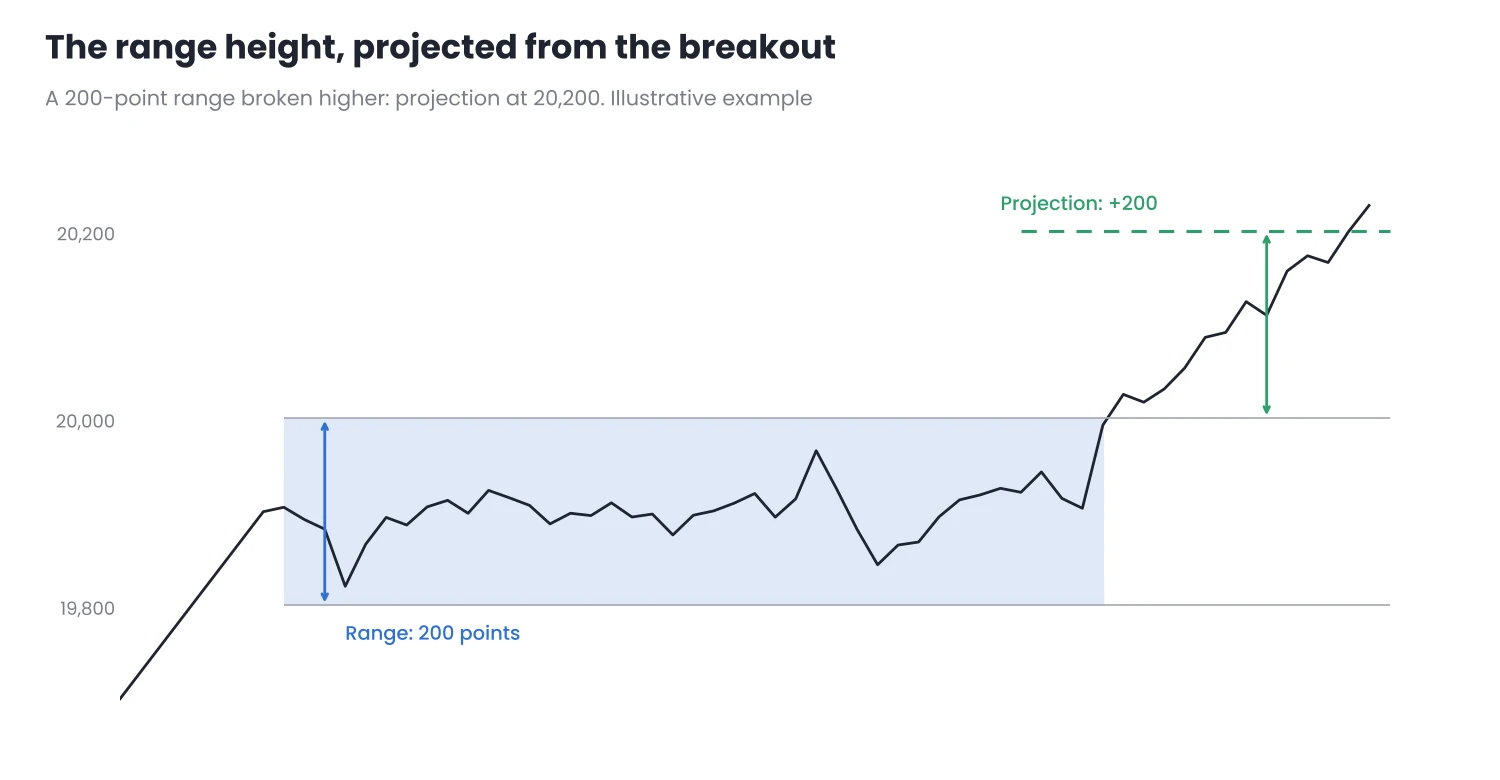
Figure 1. The range height projected from the breakout level.
The height of a pattern
Classic patterns follow the same idea:
- Head and shoulders: the distance between the head and the neckline, projected from the point where the price breaks it.
- Triangles: the height of the widest part, projected from the breakout.
- Flags: the length of the previous move (the “pole”), projected from the breakout of the flag.
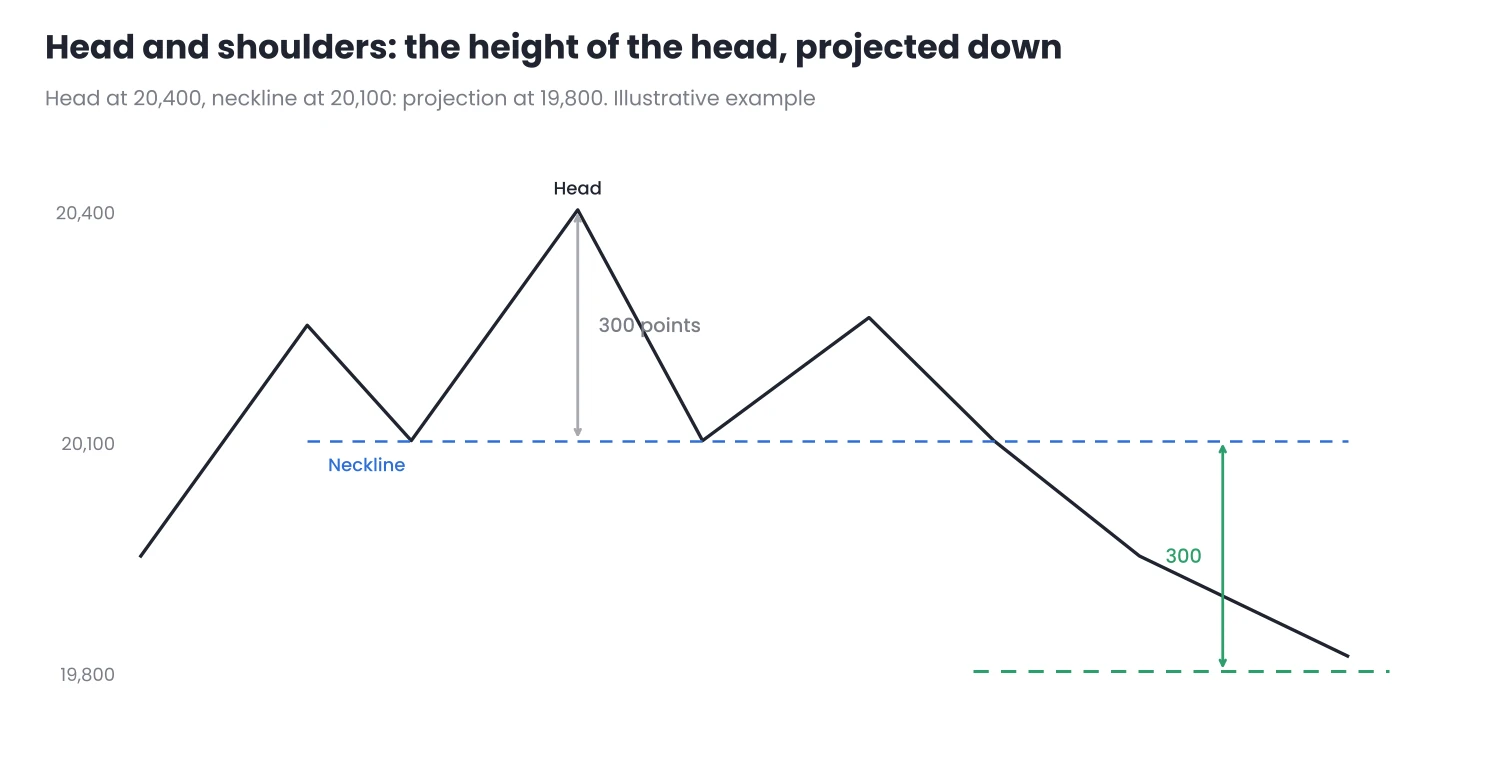
Figure 2. In a head and shoulders, the height of the head is projected from the neckline.
The width of a channel
In a channel, the natural target of a bounce is the opposite line of the channel. If the channel breaks, its width can be projected from the breakout point, with the same logic as a range.
3. The next level, almost always more realistic
A projection does not take into account what lies in the way. If there is a previous high, a support or resistance zone or a level where the price has already stopped several times between the entry and the target, that level is usually a more prudent reference.
A simple rule: use the closer one of the projection and the next relevant level. If the trade does not meet your plan’s minimum with that target, there is no trade.
4. How reliable they are
Projections are approximations. In practice:
- The price often falls short or overshoots. Treating the target as a zone, not an exact price, avoids frustration and orders left a few points away.
- How you measure changes the result. With wicks or closes, with one breakout point or another, the projection moves. What matters is measuring the same way every time.
- There is no universal hit rate. If you want to know how often the projection is reached on your assets, count it in your own history.
5. Target and risk
With the entry, the stop and the target you can calculate how many times the risk the trade offers:
| Price | |
|---|---|
| Entry (buy after the breakout) | 20,010 |
| Stop (inside the range) | 19,930 |
| Risk | 80 points |
| Range projection | 20,200 |
| Next relevant high | 20,150 |
| Target used (the closer one) | 20,150 |
| Distance to target | 140 points |
| Reward / risk | 1.75R |
Illustrative example. It does not include costs.
If your plan requires at least 1.5R, this trade qualifies. If it required 2R, it would not.
6. How to measure it in MT5
- Crosshair. By clicking the middle mouse button or choosing the crosshair on the toolbar, you can drag between two points and MT5 shows the distance in bars, points and price. It is the fastest way to measure the height of a range or a pattern.
- Rectangles and lines. Mark the range with a rectangle and the projection with a horizontal line, so you can see at a glance whether there are levels in the way.
- Always the same way. Decide whether you measure with wicks or closes, and from which point you project, and write it in your plan.
To draw ranges, levels and zones with fewer clicks you can use SnapDraw, a drawing panel for MT5. It only draws on the chart: it does not open or close trades or give signals.
Conclusion
- The target is for deciding whether the trade is worth it, not for predicting the exact price.
- Projections are based on a measurement: the height of the range, of the pattern or the width of the channel, added from the breakout.
- Use the closer one of the projection and the next relevant level, and treat the result as a zone.
In your next trades, calculate the target before entering and record in your journal whether it was reached. After a few dozen cases you will know how much you can rely on it. Do it first on a demo account.
Want to bring this to your chart?
Jasopex tools for MetaTrader help you plan your risk before you trade.
See the tools