

Bollinger Bands: Touching the Band Is Not a Signal
What Bollinger Bands measure, why the price can ride the upper band for a whole trend, when touches make sense in a range and how they differ from ATR.
“The price has touched the upper band: it is expensive, time to sell.” It is the most common reading of Bollinger Bands and, in a trend, one of the most costly. The bands do not mark expensive or cheap prices: they mark how far the price is moving from its average relative to its recent volatility. This article explains what they measure, why a touch is not a signal and how to read them sensibly.
1. What they are
John Bollinger designed them with three lines:
- Middle band: a simple moving average, 20 periods by default.
- Upper band: the average plus two standard deviations of the closes over those 20 periods.
- Lower band: the average minus two standard deviations.
The standard deviation measures how spread out prices are around their average. When the price moves a lot, the bands widen; when it calms down, they narrow. That is why the bands are, above all, a measure of volatility drawn on the price.
2. Why touching the band is not a signal
In a strong trend, the price closes near its highs again and again. The average rises, but the price rises faster, so it stays close to the upper band for many candles. This is often called “walking the band”.
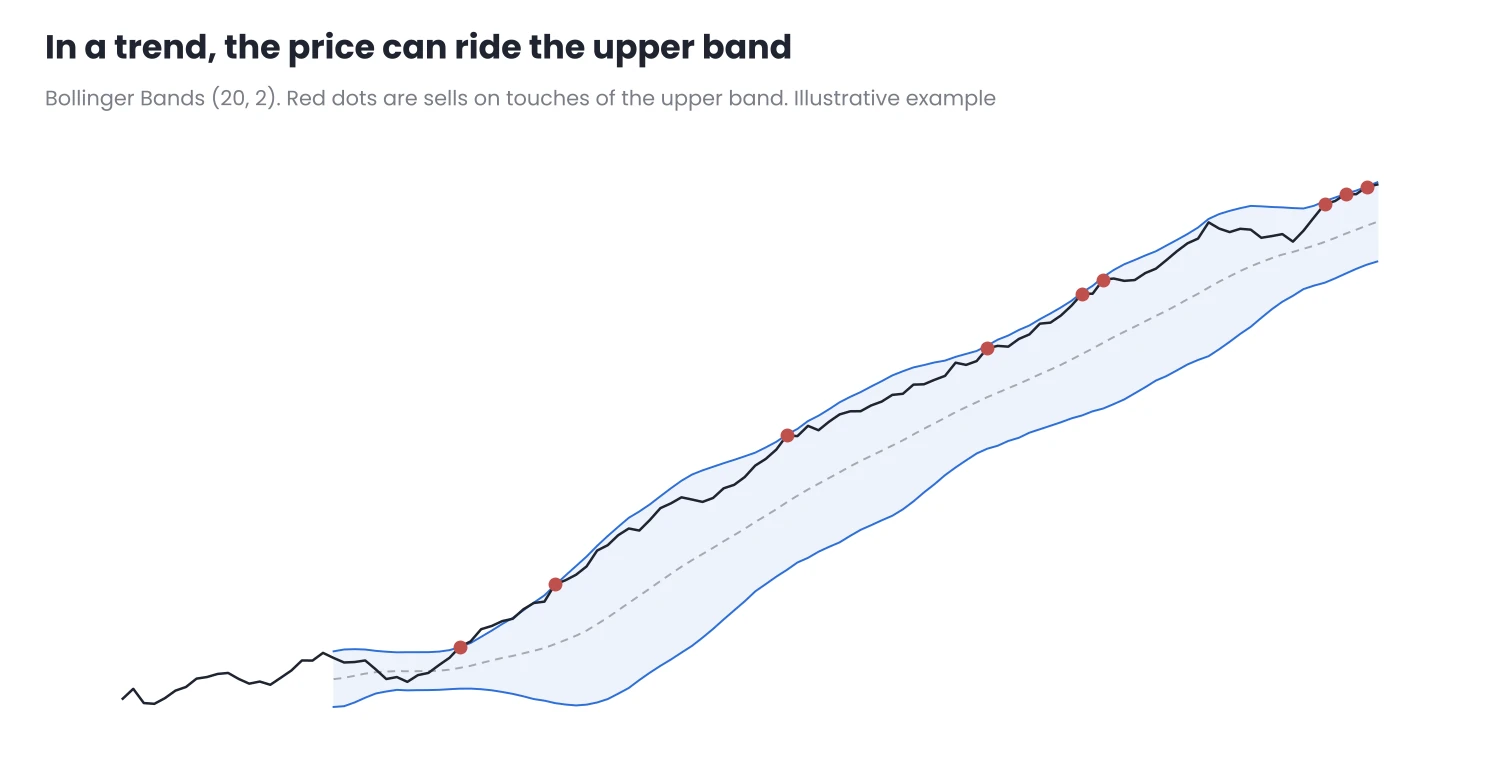
Figure 1. In a trend, the price can lean on the upper band again and again. Every touch, sold, would have gone against the move.
Just as RSI can stay overbought for weeks, as I explain in Overbought Doesn’t Mean Sell, the price can spend weeks next to the band. A touch only says that the recent move has been strong relative to the volatility of the last few candles.
3. When touches make more sense
In a clear range, with no rising or falling highs and lows, the price oscillates around its average and the band extremes tend to coincide with the range extremes. There, a band touch can be a reasonable reference, always combined with the range level.
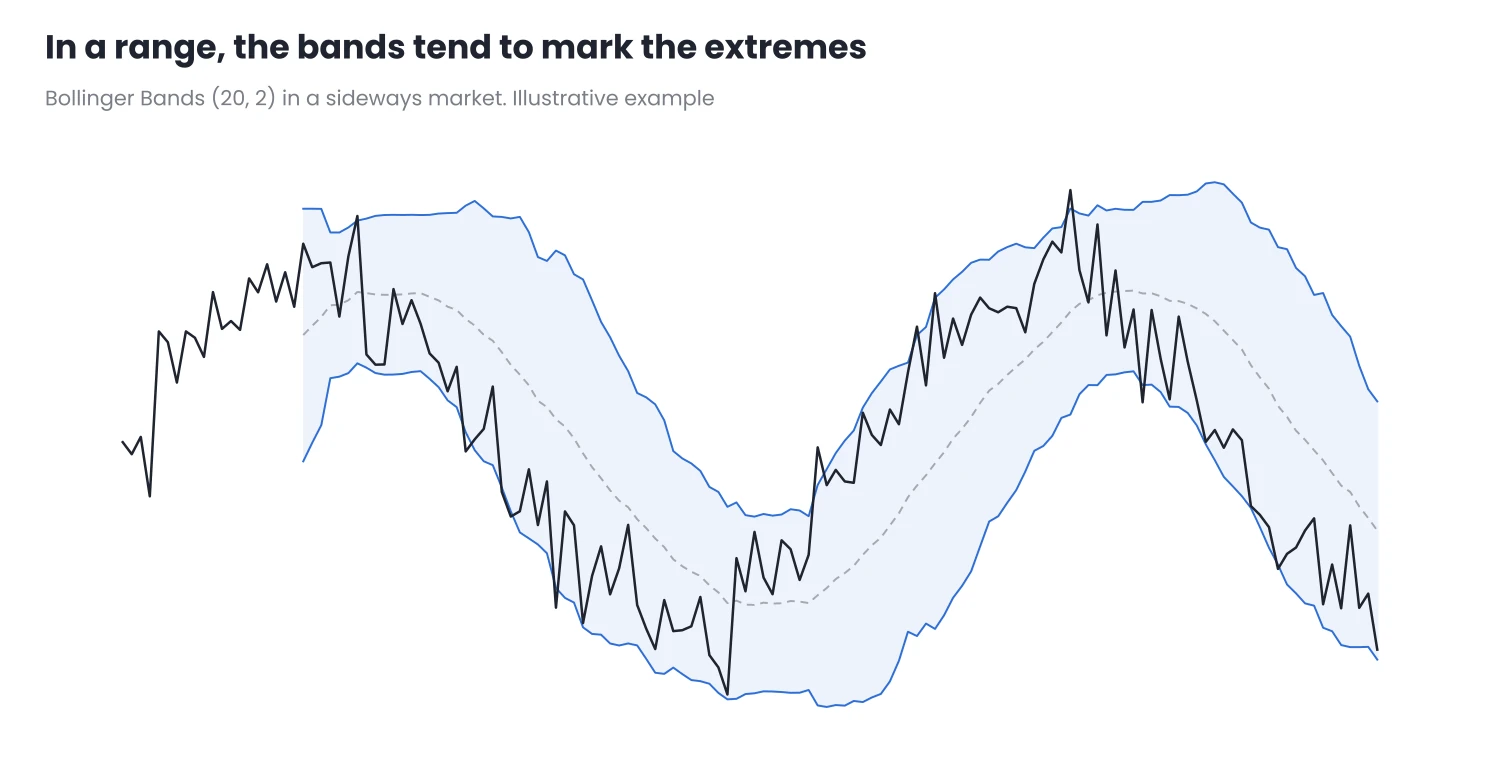
Figure 2. In a range, the bands tend to mark the extremes of the move, together with the range’s own levels.
The key is to know first what kind of market you are in. I explain how to define it with highs and lows in What Is a Trend?.
4. Readings that do add something
- The middle band as a reference in a trend. In a healthy uptrend, pullbacks often stop near the middle band. It is a zone, not an exact level.
- Where the price sits within the bands. Near the upper one, in the middle or near the lower one. Comparing that position over time tells you whether momentum is holding or fading.
- Band width as a measure of volatility. Wide bands indicate a busy market; narrow ones, a quiet one. It is the same idea we saw with ATR in the ATR from Scratch series.
5. Bollinger and ATR: similar, not the same
Both tools measure volatility, but differently:
| Bollinger Bands | ATR | |
|---|---|---|
| What it uses | Closes | The true range, with highs, lows and gaps |
| How it shows it | Bands on the price | A value below the chart |
| Best suited to | Seeing the price’s position relative to its average | Calculating stops and position sizes |
If you want to place a stop or calculate a lot size, ATR is more direct. If you want to see at a glance whether the price is stretched relative to its average, the bands are more visual.
6. In MetaTrader
- Where they are: Insert → Indicators → Trend → Bollinger Bands, in MT4 and MT5.
- Parameters: period (20 by default), deviations (2 by default) and shift. As with the ATR period, the defaults are not a rule: if you change them, do it for a reason and keep them.
- To compare with ATR, add both to the same chart and watch how the bands widen when ATR rises.
Common mistakes
- Selling every touch of the upper band without checking whether the market is trending.
- Treating the band as an exact level. The price can cross it and keep going.
- Changing the period or deviations until the chart “fits”.
Conclusion
- Bollinger Bands measure volatility around an average, not whether the price is expensive or cheap.
- In a trend, the price can ride the band for a long time. A touch is not a reversal signal.
- In a range, touches make more sense, always together with the range levels and knowing first what kind of market you are in.
Add the bands to a chart you trade and look at the last few trends: count how many times the price touched the upper band before it really turned.
Want to bring this to your chart?
Jasopex tools for MetaTrader help you plan your risk before you trade.
See the tools