

Overbought Doesn't Mean Sell: RSI and Stochastic in a Trend
What RSI and the stochastic measure, why they can stay overbought for weeks during a trend and how to use them with the trend rather than against it in MT5.
“RSI is above 70, the market is overbought, time to sell.” It is one of the most common readings of oscillators and one of the most expensive in a trend. An asset can stay “overbought” for weeks while it keeps rising. This article explains what RSI and the stochastic really measure, why they stay at the extremes during trends and how to use them with the trend.
1. What they measure
RSI
RSI (Relative Strength Index) compares the average of the up moves with the average of the down moves over the last N candles, 14 by default in MT5, and expresses it on a scale from 0 to 100. A high RSI means that in that period the up moves have far outweighed the down moves. Nothing more.
Stochastic
The stochastic shows where the current close sits within the range of highs and lows of the last N candles. In MT5 its default parameters are 5, 3 and 3 (%K period, %D period and slowing). A stochastic of 90 means the price is closing near the high of that range.
Both oscillators describe recent momentum. Neither of them measures whether the price is expensive or cheap.
2. Why “overbought” is not a sell signal
In a strong uptrend, up moves outweigh down moves for a long time and the price closes again and again near its highs. That is exactly what RSI and the stochastic measure, so they stay in the upper zone. Selling every time they cross 70 or 80 is selling against the trend.
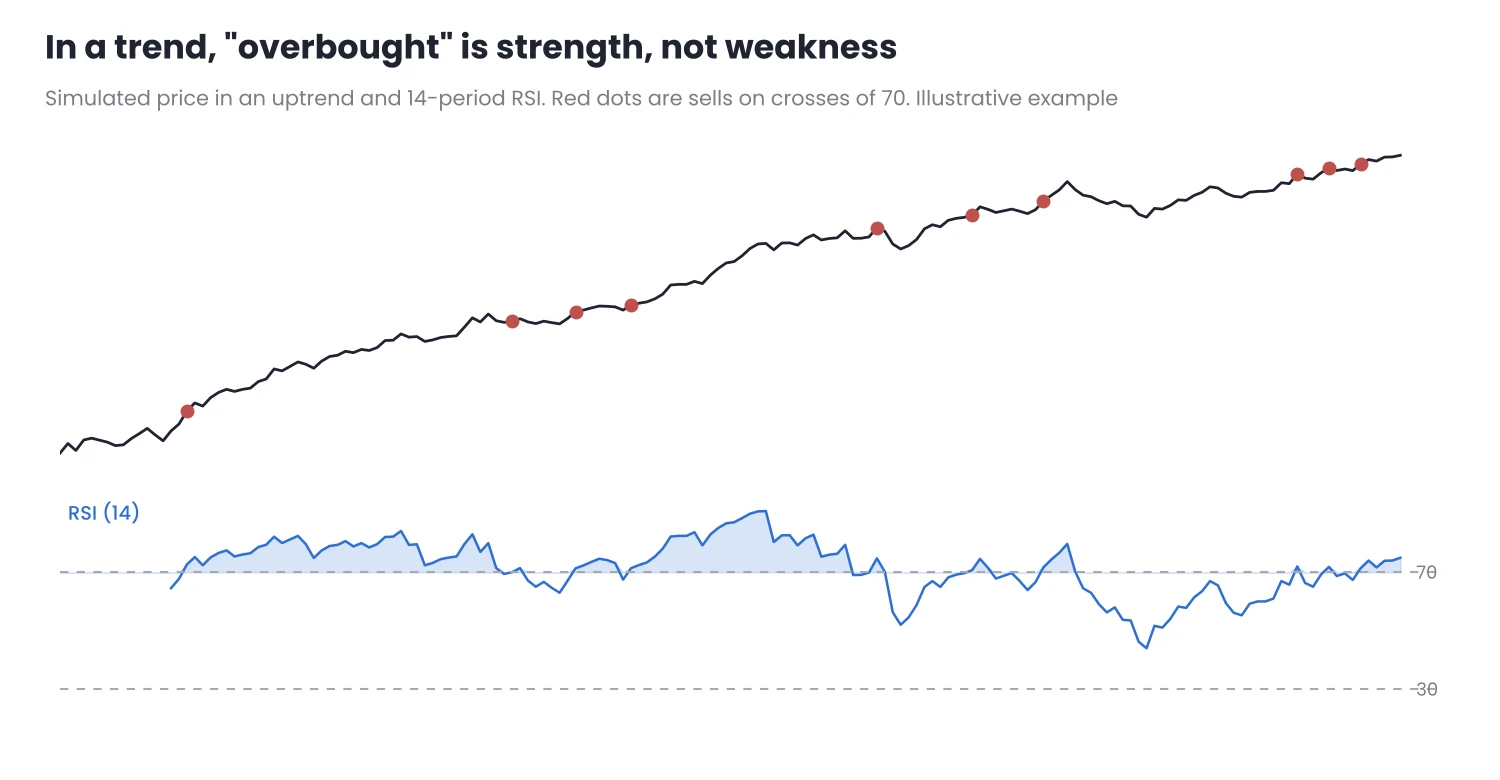
Figure 1. In a trend, every move into “overbought” is a sell against the main move.
The problem is not the indicator, but the reading. An RSI above 70 in an uptrend does not indicate weakness, but strength.
3. The oscillator’s range shifts with the trend
A more useful way to read RSI is to look at the zone it moves in, not at whether it touches the extremes:
| Context | Usual RSI zone | What it usually indicates |
|---|---|---|
| Uptrend | Between 40 and 80 | Pullbacks stop around 40–50 |
| Range | Between 30 and 70 | The extremes work better as turning zones |
| Downtrend | Between 20 and 60 | Bounces stop around 50–60 |
Indicative zones. They depend on the asset, the timeframe and the indicator period.
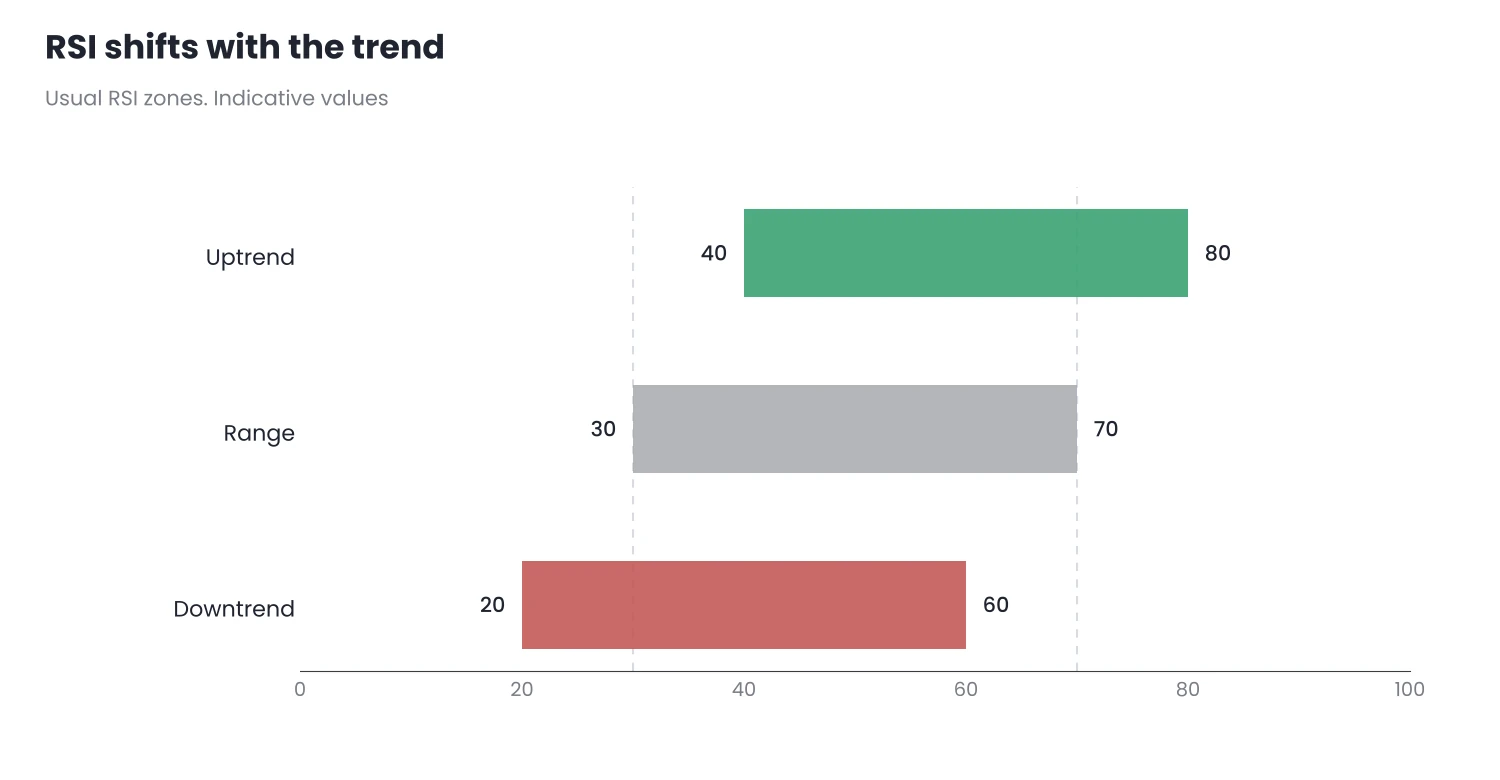
Figure 2. RSI shifts up or down depending on the trend.
When an RSI that bounced around 40 in an uptrend starts falling to 30, it is a sign that the trend is losing strength, more useful than any cross of 70.
4. How to use them with the trend
- Define the trend with price first, not with the oscillator. I explain how in What Is a Trend?.
- In an uptrend, look for buys on pullbacks: when RSI drops to the 40–50 zone and turns up again, or when the stochastic falls below 20 and rises again. These are pullback zones within the trend, not reversal signals.
- In a downtrend, the same in reverse: sells on bounces, when RSI rises to 50–60 and turns down again.
- In a range, the extremes make more sense, as long as the range is clear: no rising or falling highs and lows.
5. In MT5
RSI and the stochastic are under Insert → Indicators → Oscillators. A few practical details:
- The period changes the reading. With a short period, the oscillator touches the extremes much more often. If you change the period, the useful zones change too.
- Levels can be adjusted. In the indicator’s Levels tab you can add lines at 40 and 60, as well as 30 and 70, to see the zones in the table more clearly.
- The stochastic has two calculation modes. The price field can be Low/High or Close/Close; the first uses lows and highs and reacts more to wicks.
Common mistakes
- Selling overbought without looking at the trend. In an uptrend, it is the fastest way to pile up small losses.
- Using the oscillator to define the trend. The oscillator describes momentum; highs and lows define the trend.
- Adjusting the period until it “works”. If the period changes every time a trade goes wrong, it is no longer a rule.
Conclusion
- RSI and the stochastic measure momentum, not whether the price is expensive or cheap. In a trend they can stay at the extremes for a long time.
- The zone the oscillator moves in says more than crosses of 70 or 30. In an uptrend it usually moves between 40 and 80; in a downtrend, between 20 and 60.
- Use them with the trend, to find pullbacks, and keep the extremes for clear ranges.
Try adding the 40 and 60 lines to RSI on your charts and watch for a few weeks where your assets’ pullbacks stop. Do it first on a demo account.
Want to bring this to your chart?
Jasopex tools for MetaTrader help you plan your risk before you trade.
See the tools