

Pivot Points: How They Are Calculated and Why They Differ Between Brokers
The classic pivot point formula, why two brokers show different levels for the same day, what happens with the Sunday candle and with indices, and how to use pivots as a reference.
Pivot points are levels calculated from the previous day’s high, low and close. They are popular in intraday trading because they are calculated before the session opens and do not depend on how each trader draws the chart. But they have a little-known catch: the result depends on when the day ends for your broker. This article explains how they are calculated, why they differ between platforms and how to use them sensibly.
1. The classic formula
With the previous day’s high (H), low (L) and close (C):
Pivot (P) = (H + L + C) ÷ 3
| Level | Formula |
|---|---|
| R2 | P + (H − L) |
| R1 | 2 × P − L |
| Pivot | (H + L + C) ÷ 3 |
| S1 | 2 × P − H |
| S2 | P − (H − L) |
Example with a day with a high of 20,200, a low of 19,900 and a close of 20,100:
| Level | Value |
|---|---|
| R2 | 20,367 |
| R1 | 20,233 |
| Pivot | 20,067 |
| S1 | 19,933 |
| S2 | 19,767 |
Illustrative example, with rounded values.
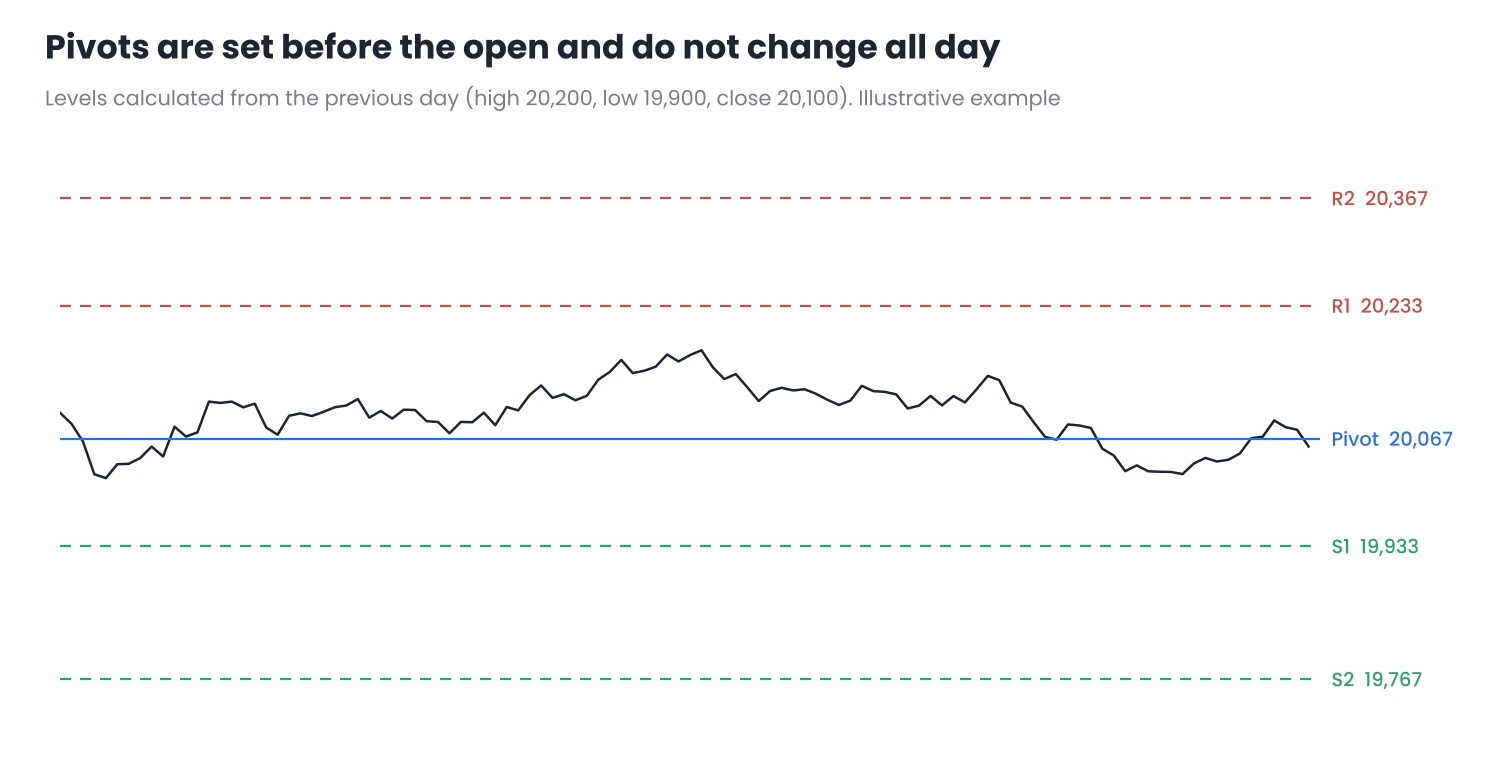
Figure 1. The levels are calculated before the session and stay fixed for the whole day.
There are other variants, such as Woodie, Camarilla or Fibonacci pivots, with different formulas. What matters is choosing one and not switching variant depending on what “fits” each day.
2. Why they differ between brokers
The formula uses the high, low and close of the daily candle. And the daily candle starts and ends at each broker’s server time. A broker with a GMT+2/GMT+3 server closes the day at 17:00 New York time; one with GMT+0 closes it several hours earlier. The same market hours are split differently between two candles, and the levels change.
| Broker A | Broker B | |
|---|---|---|
| Previous day’s high | 20,200 | 20,230 |
| Previous day’s low | 19,900 | 19,880 |
| Previous day’s close | 20,100 | 20,100 |
| Pivot | 20,067 | 20,070 |
| R1 | 20,233 | 20,260 |
| S2 | 19,767 | 19,720 |
Illustrative example of the same market day with two different closing times.
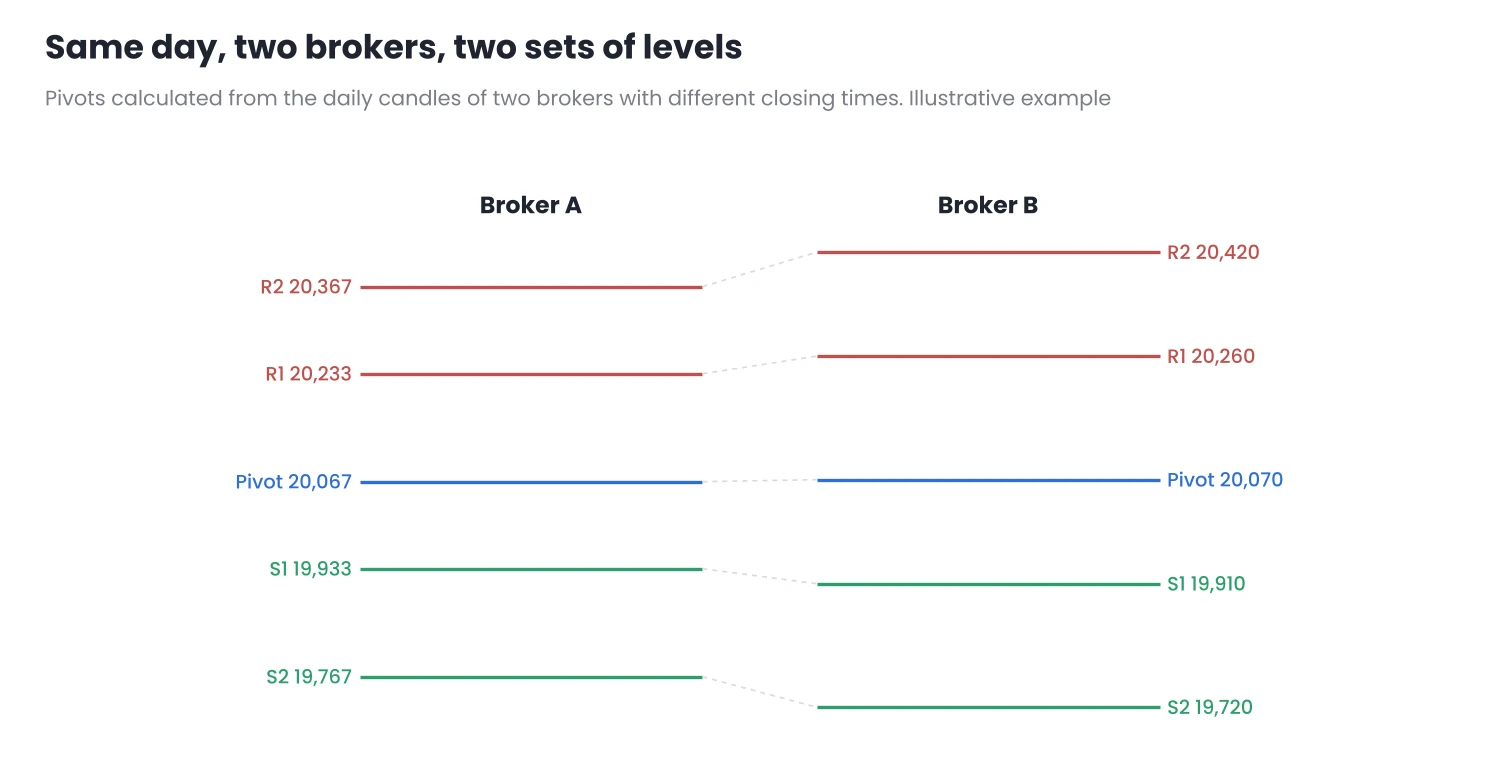
Figure 2. Same market, same day: up to 47 points of difference on S2.
That is why, when someone shares “today’s pivots”, they are only useful if they were calculated with the same closing time your chart uses. I explain how to find your broker’s server time in Market Sessions and Server Time in MT5.
The Sunday candle
If your broker has a small Sunday daily candle, Monday’s pivots would be calculated from those few hours of trading and would come out very close together. Many indicators solve this by using Friday, but not all of them. Check what yours does.
Indices: cash session or 24 hours
With index CFDs there is another decision. DE40 trades almost all day, but the reference market is only open from 9:00 to 17:30 CET. Pivots calculated from the CFD’s 24-hour candle do not match those calculated from the cash session. Neither is wrong, but you need to know which one you use.
3. How to use them
- As reference zones, not exact levels. As with any level, the price can overshoot or fall short by a few points.
- With confluence. A pivot that coincides with a previous high or low, or with a zone marked on a higher timeframe, is more interesting than an isolated one.
- To place the day in context. Opening above or below the pivot gives a quick sense of the session’s tone, without any other indicator.
- Without treating them as signals. Many traders watching them may make the price react nearby, but that does not turn them into guaranteed turning points.
4. In MT5
MT5 does not include pivot points among its standard indicators. You have two options:
- Calculate them by hand: open the Data Window (Ctrl + D), hover over the previous daily candle and note the high, low and close. With the formula in the table you have the levels in a minute.
- Use an indicator: many are available in the Code Base and the Market. Before relying on one, check which daily candle it uses, what it does with Sunday and whether it lets you choose the session.
To mark the levels by hand with horizontal lines quickly you can use SnapDraw, which only draws on the chart: it does not open or close trades or give signals.
Conclusion
- Pivots are calculated from the previous day’s high, low and close, and stay fixed during the session.
- They change with each broker’s daily closing time, with how Sunday is handled and, on indices, with whether the cash session or the 24-hour session is used.
- Use them as reference zones and with confluence, not as guaranteed turning points.
Calculate the pivots of one of your assets by hand today and compare them with another platform’s. If they do not match, now you know why.
Want to bring this to your chart?
Jasopex tools for MetaTrader help you plan your risk before you trade.
See the tools