

Practising a Manual Strategy on Historical Data
How to practise a discretionary strategy candle by candle on past data, how many trades you need before drawing conclusions, the limits of practice and how to do it with the MetaTrader strategy tester.
Anyone trading an automated system can run a backtest in minutes. Anyone trading by hand, with rules that involve some judgement, does not have that option: their strategy can only be tested by applying it. The alternative is to practise on historical data, candle by candle, as if it were live. Done well, it lets you gather months of market experience in a few weeks. This article explains how to do it and what its limits are.
1. What practising on historical data is for
- Checking that the rules can be applied. Many rules that seem clear in your head turn out to be ambiguous when you have to decide on a specific candle.
- Accumulating trades. Live, a 4-hour strategy may produce one or two trades a week. On historical data, you can go through several months in an afternoon.
- Training your eye. Seeing the same kind of situation many times makes you recognise it faster in real time.
2. How to do it well
- Write down the rules before you start. Entry, stop, exit and management, as they would be in your trading plan. If you change them halfway, start again.
- Choose a period you do not know well. If you remember what the price did, your decisions will be contaminated.
- Move forward candle by candle without looking ahead. Decide on each candle with what you can see up to that point.
- Record the decision before moving on. Entry, stop and target, in a spreadsheet or in your journal. Whatever is not written down beforehand gets “remembered” better than it was.
- Record the result in R, that is, in multiples of the initial risk. That way you can compare trades with different stops.
3. How many trades you need
With few trades, the results say very little. If a strategy really wins 50% of the time, the win rate you see in a small sample can be very different:
| Trades practised | Win rate you may see (90% of cases) |
|---|---|
| 20 | between 32% and 68% |
| 50 | between 38% and 62% |
| 100 | between 42% and 58% |
| 300 | between 45% and 55% |
Strategy with a true 50% win rate and independent trades. Statistical approximation.
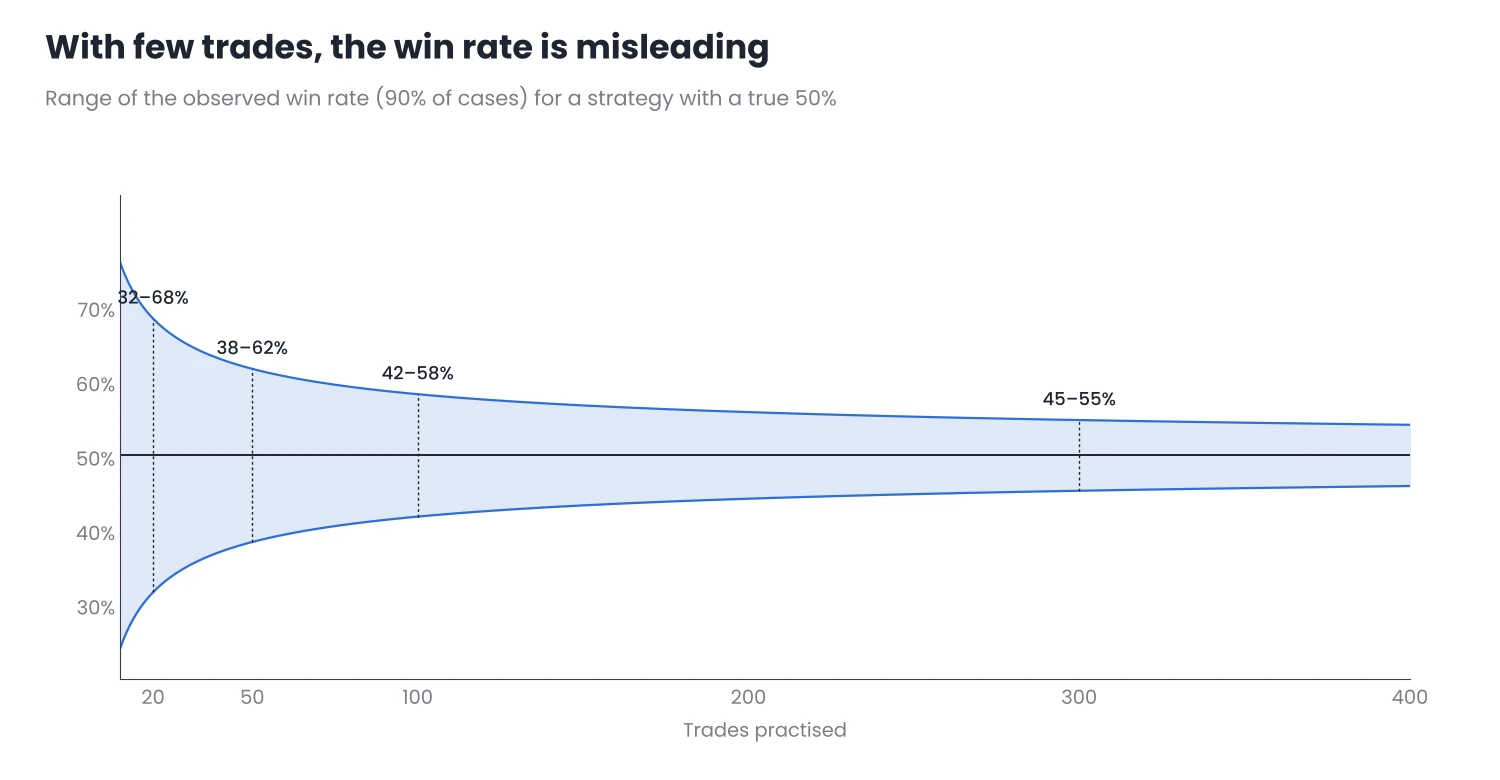
Figure 1. With 20 trades, a true 50% can look like 32% or 68%. With 300, the margin narrows a lot.
That is why it is best not to draw conclusions before about 50 trades, and ideally 100 or more. Changing the rules after the first 10 is reacting to noise.
4. The limits of practice
Practising on historical data helps a lot, but it does not replace live trading:
- Hindsight bias. Even if you do not look ahead, you know how the market ended up in general, and that has an influence.
- No real emotions. Losing in practice does not feel the same as losing money, so discipline seems easier than it is.
- Costs and execution. Spread, slippage and gaps are not always reproduced well.
That is why the sensible order is: practice on historical data, then a demo account in real time and, finally, live trading with small risk. Each step validates something the previous one could not.
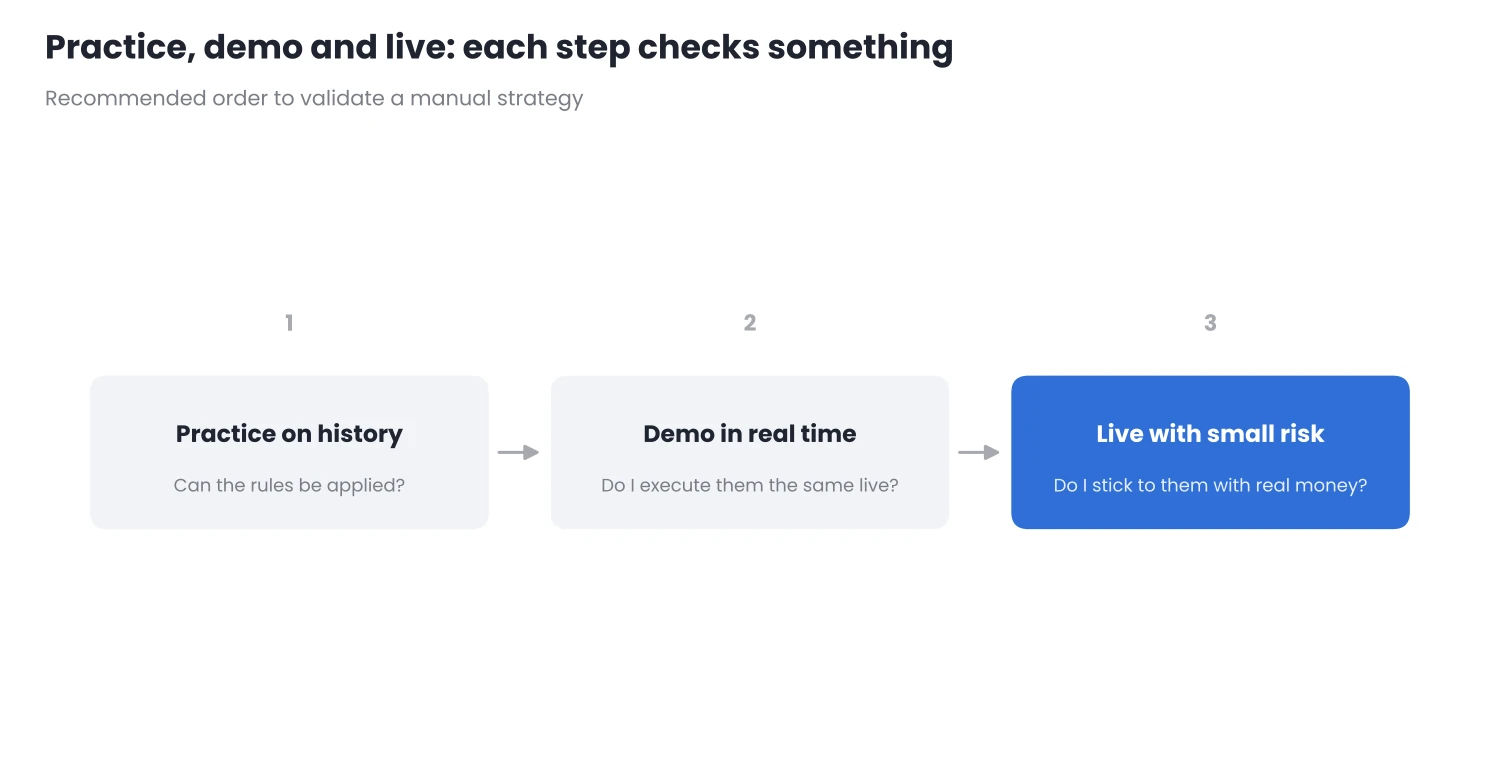
Figure 2. Each step checks something different: the rules, real-time execution and management with real money.
5. In MetaTrader
- The strategy tester in MT4 and MT5 has a visual mode that replays the chart candle by candle at the speed you choose, with a pause button. It is the most convenient way to move forward without seeing the future.
- Visual mode is designed for testing EAs, so it does not allow manual trading out of the box. To practise, you can pause on each candle and record your decisions in a spreadsheet, or use a utility that adds trading buttons to the tester.
- Another simple option is to scroll the chart back and move forward little by little, covering the right-hand side. It is less convenient, but it works in any version.
- To mark zones and levels while you practise, in MT5 you can use SnapDraw, which only draws on the chart.
Conclusion
- Practising on historical data checks that the rules can be applied and builds experience quickly.
- You need many trades: with 20 you know almost nothing; with 100 or more, the result starts to be reliable.
- It does not replace real time. After practice come the demo and live trading with small risk.
Choose a month of historical data you do not remember, write down your rules and practise 50 trades, recording each decision before moving to the next candle.
Want to bring this to your chart?
Jasopex tools for MetaTrader help you plan your risk before you trade.
See the tools