

Volume Profile: Where Most Trading Happened and Why It Matters
What a volume profile is, what the point of control, the value area and high- and low-volume nodes indicate, the limits of CFD tick volume and how to use it in MT5.
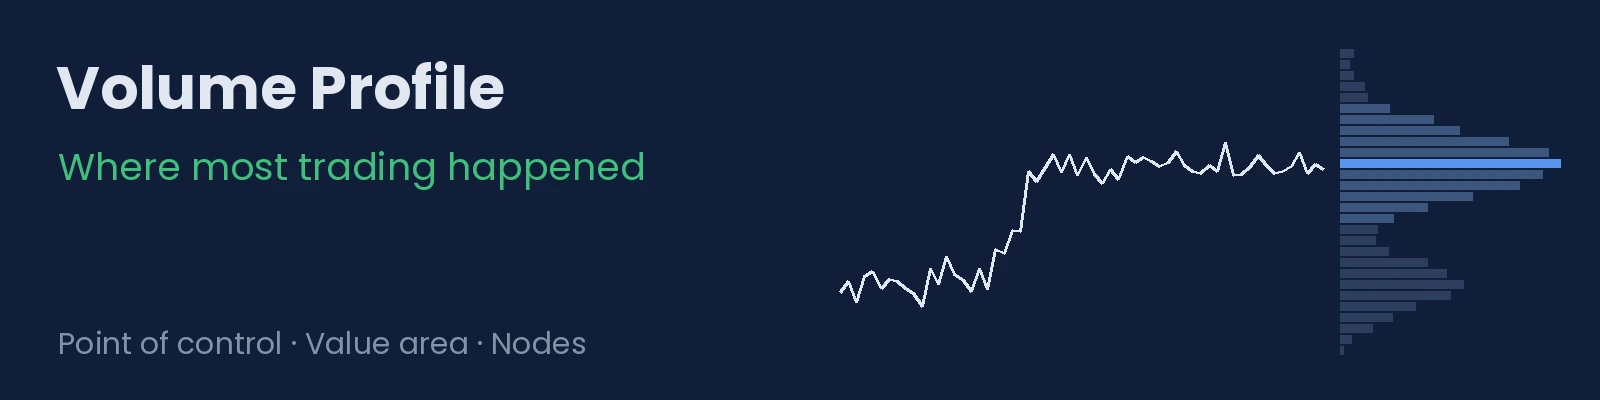
The volume shown below the chart tells you how much was traded in each period of time. A volume profile reorganises it differently: how much was traded at each price level. That difference lets you see which prices the market accepted and which ones it passed through quickly, something volume per candle does not show. This article explains how to read it, what its limits are on CFDs and how to use it as a reference.
1. Volume by time and volume by price
On a normal chart, each volume bar corresponds to a candle: how much was traded in that hour or that day. A volume profile takes a period, for example a session or a week, and distributes the volume across the price levels the market passed through. The result is a horizontal histogram next to the price.
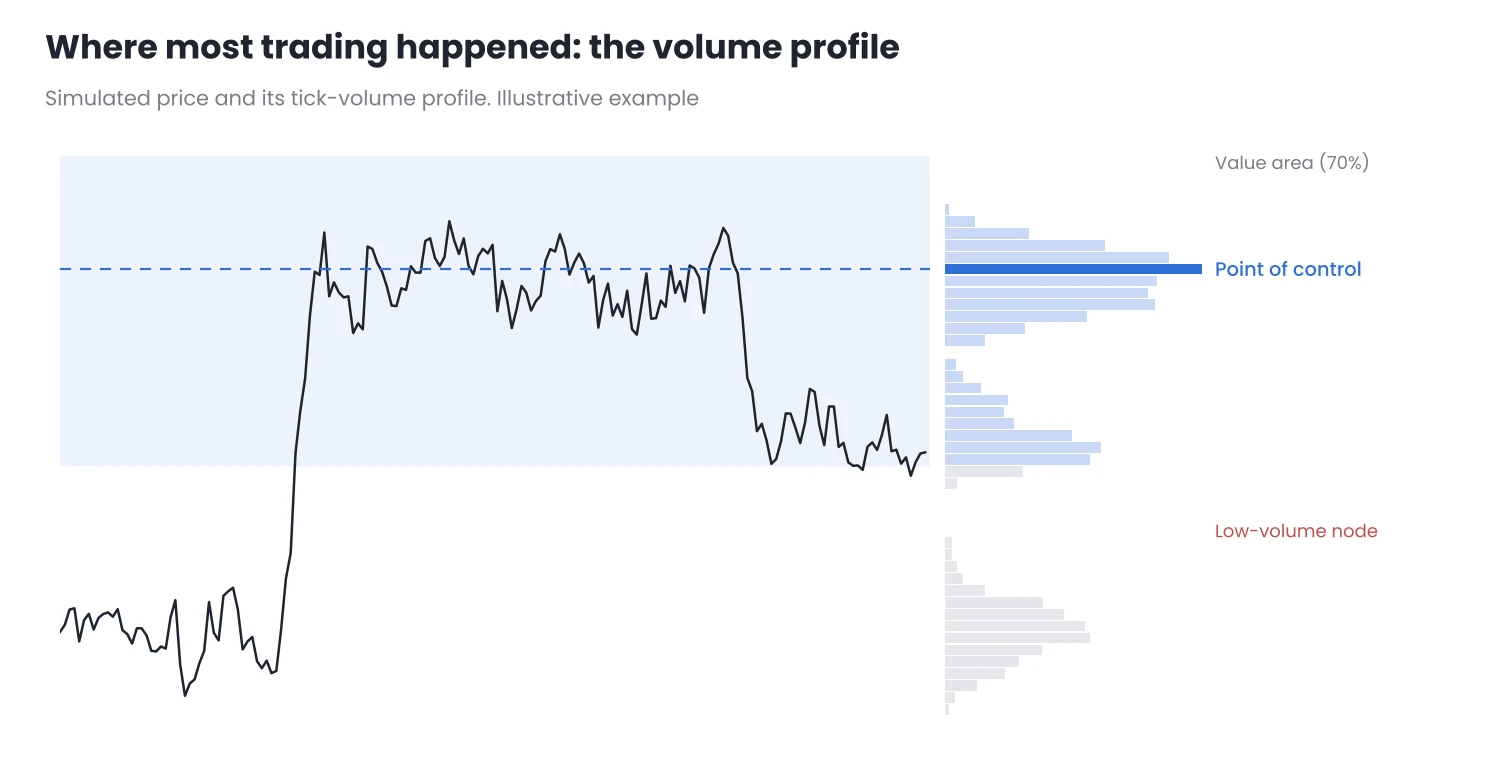
Figure 1. The profile shows at which prices the period’s activity was concentrated.
2. The parts of a profile
- Point of control (POC): the price level with the most volume in the period. It is the price the market considered most “fair” in that stretch.
- Value area: the band around the point of control where a large part of the volume is concentrated, by convention 70%. Above and below it are the prices the market visited less.
- High-volume nodes: wide areas of the histogram. The price spent a lot of time there and tends to slow down or consolidate when it returns.
- Low-volume nodes: narrow areas. The price crossed them quickly, with little trading, and often crosses them quickly again.
The underlying reading is simple: where there was a lot of volume, buyers and sellers agreed; where there was little, the price moved on looking for that agreement elsewhere.
3. The limit on CFDs: tick volume
On most MT5 CFDs there is no real volume, but tick volume: the number of price changes in each candle. It measures activity, not contracts traded, and it depends on the broker. I explain this in Tick Volume in MT5, on the MQL5 blog.
A profile built with tick volume is still useful, but it should be read as an activity profile: it shows where the price spent most time and was most active, not where most money changed hands. Two practical consequences:
- Do not compare profiles across brokers. Each one’s tick volume is different.
- Look at the shape, not the figures. Where the point of control and the nodes are matters more than the exact number in each bar.
An alternative that does not depend on volume is the time profile: counting how many candles touched each price level. With tick data, the two profiles are usually quite similar.
4. The period changes the profile
There is no single profile: it depends on the stretch you choose.
- Session or daily profile: useful for intraday trading. It shows where trading took place the previous day.
- Weekly or range profile: more stable. It shows the acceptance zones of a longer period.
- Profile of a specific move: for example, from the start of a trend. It helps you see where activity was concentrated within that move.
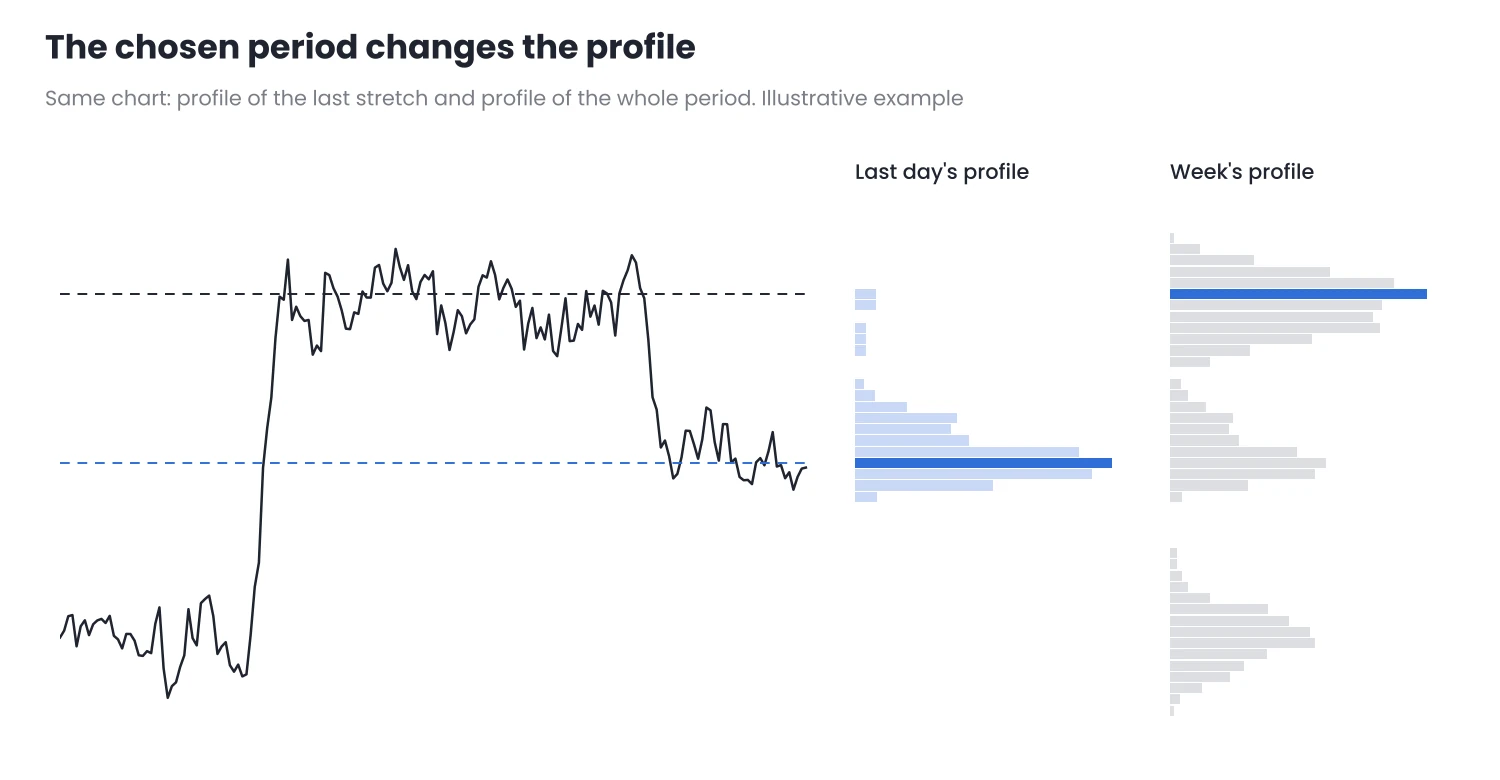
Figure 2. The last day’s profile and the week’s profile point to different points of control.
As with any tool, what matters is choosing a criterion and sticking to it.
5. How to use it
- As reference zones. The point of control and the edges of the value area work as support or resistance zones, especially if they coincide with previous highs or lows.
- To estimate the move. If the price leaves a high-volume node and enters a low-volume one, it is reasonable to expect a fast move to the next high-volume node. That node is a good target candidate, as I explain in Price Targets.
- To place the stop sensibly. A stop right in the middle of a high-volume node usually sits where the price oscillates a lot; one beyond the node makes more sense.
- Without treating it as a signal. The profile describes where there was activity. What to do in those zones is decided by your plan.
6. In MT5
MT5 does not include a volume profile among its standard indicators. There are many in the Code Base and the Market; before using one, check:
- Which volume it uses: tick or real. On CFDs it will almost always be tick volume.
- How it distributes each candle’s volume: all at the close or spread between its high and low. The second method gives more realistic profiles.
- Which period it calculates: session, day, week or a range you choose.
To mark the point of control and the profile’s zones on the chart you can use SnapDraw, which only draws: it does not open or close trades or give signals.
Conclusion
- A volume profile distributes volume by price level, not by time. It shows where the market accepted the price and where it passed through quickly.
- Its key parts are the point of control, the value area and the high- and low-volume nodes.
- On CFDs it is built with tick volume: read it as an activity profile and look at its shape, not the figures.
Add a weekly profile to one of your assets and check for a few weeks how the price reacts when it returns to its point of control and its nodes. Do it first on a demo account.
Want to bring this to your chart?
Jasopex tools for MetaTrader help you plan your risk before you trade.
See the tools