

Fibonacci Without the Magic: What Retracements Can and Cannot Do
What Fibonacci levels are, why the result depends on where you anchor them, why they seem to work so often and how to use them as a reference zone in MT5.
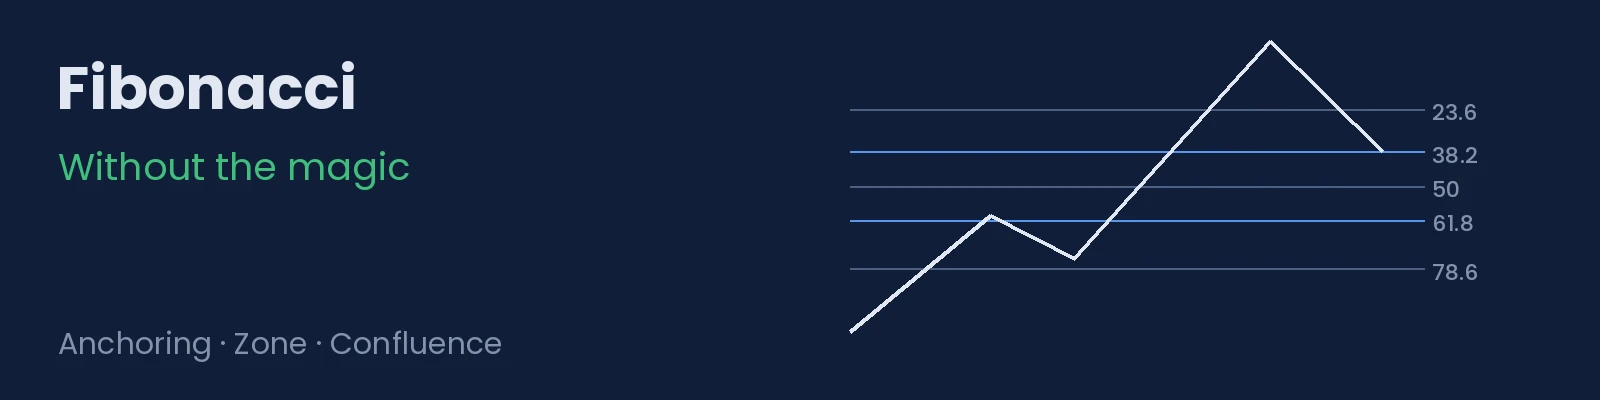
Fibonacci retracements are on almost every platform and in almost every course. They are often presented as levels where the price “has to” turn. The reality is more modest: they can be a reference zone for pullbacks, but there is nothing special about them in themselves. This article explains what they are, why they seem to work and how to use them without giving them powers they do not have.
1. What they are
The Fibonacci retracement tool takes a move, from a low to a high or the other way round, and draws lines at specific percentages of that move. The most common are 23.6%, 38.2%, 50%, 61.8% and 78.6%.
Several of those percentages come from ratios in the Fibonacci sequence. 50% does not, but it is almost always included because it is a natural reference point: half of the move.
2. The anchoring problem
The levels depend entirely on the two points you choose. If you take the low of the week or of the day, the wick or the body, you get different levels for the same pullback.
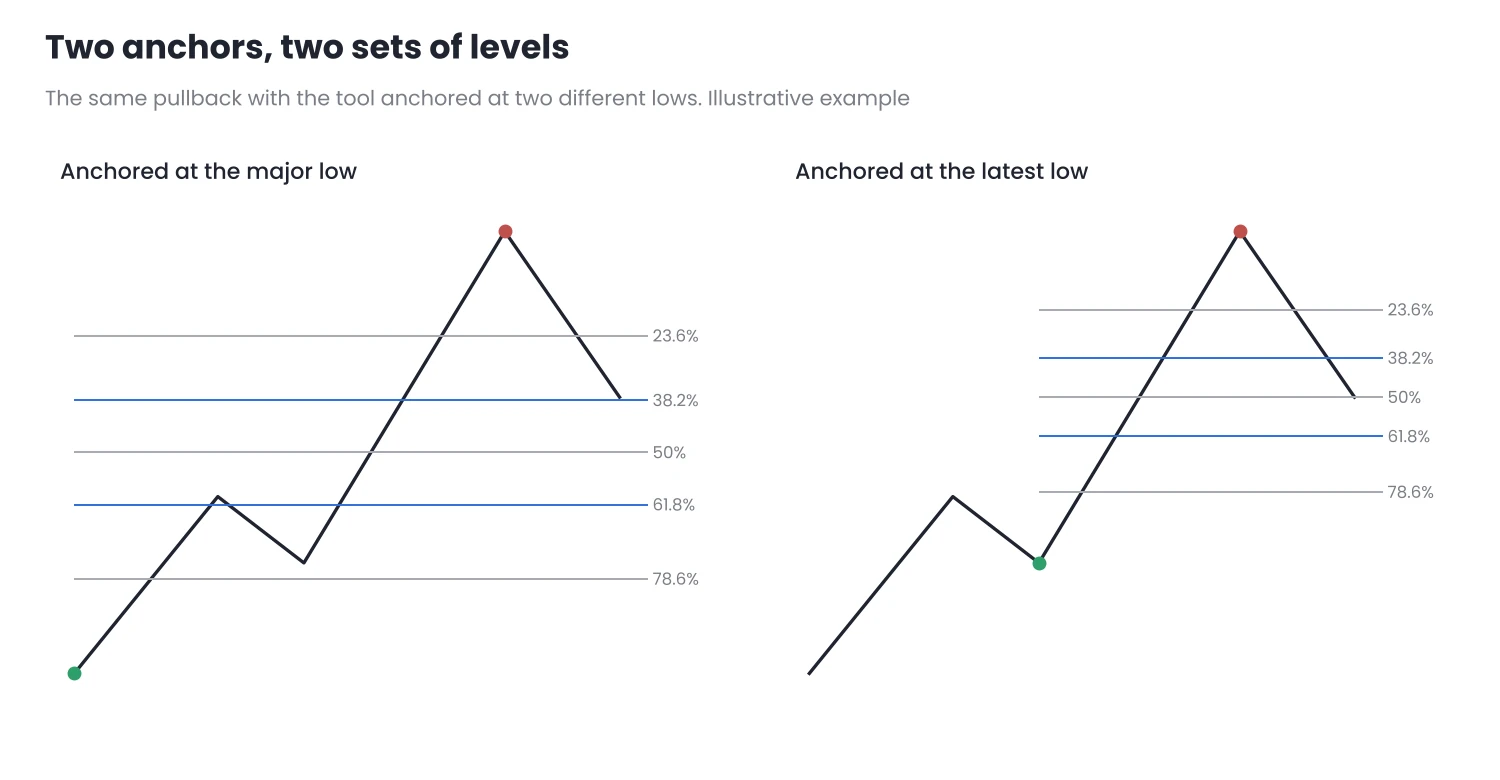
Figure 1. Same chart, two different anchors: where the pullback ends is the 38.2% of one and the 50% of the other.
That is why, before using the tool, it is worth setting a rule: always anchor it between confirmed swings on the same timeframe, with the same criterion you use to define the trend. I explain this in What Is a Trend?.
3. Why they seem to work so often
With five levels spread across the move, almost any pullback ends near one of them. If you accept a margin of a few percentage points around each level, a large part of the move is “covered”:
| Margin around each level | Part of the move covered |
|---|---|
| ± 1% of the move | 10% |
| ± 3% of the move | 30% |
| ± 5% of the move | 50% |
Calculated with the five usual levels and non-overlapping margins.
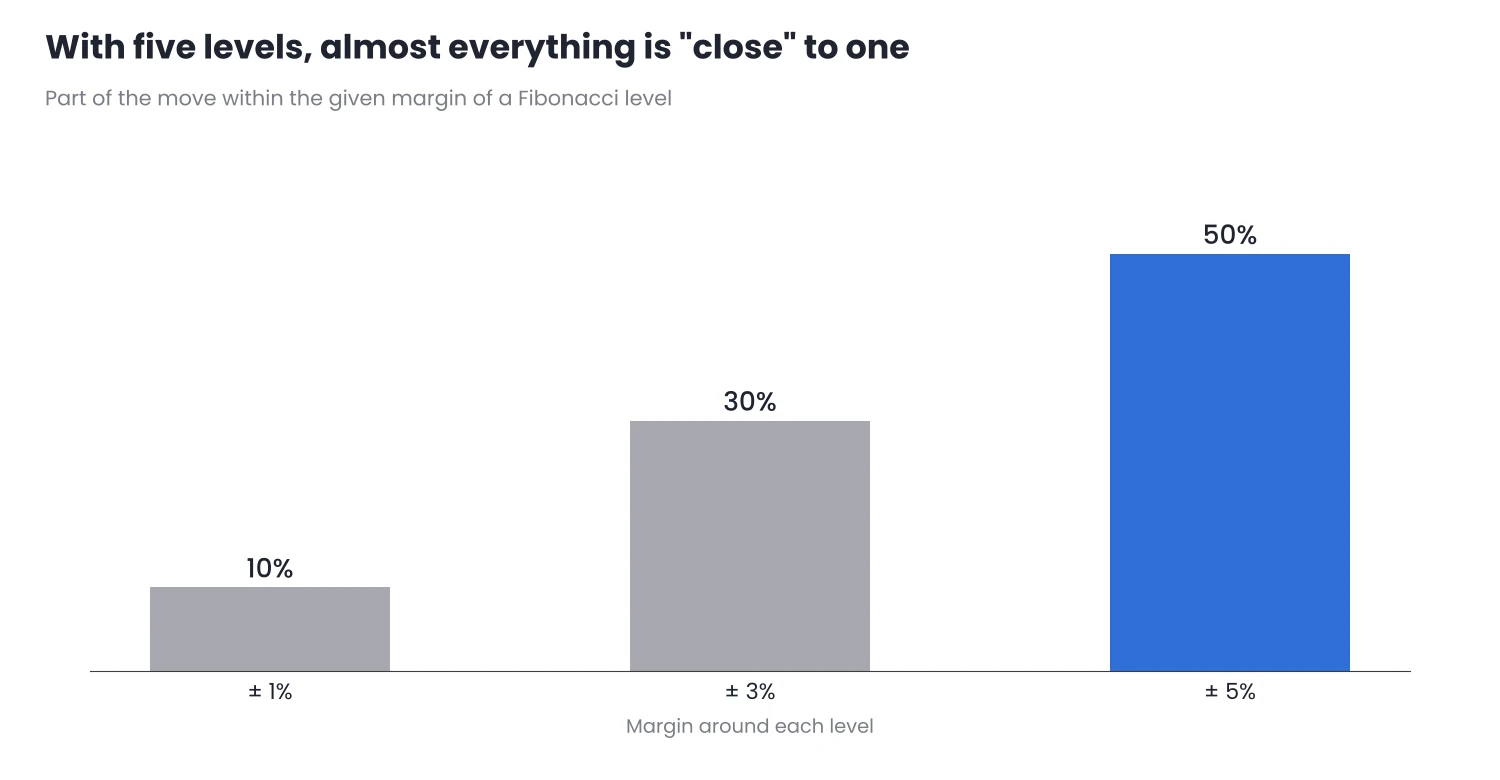
Figure 2. With a ± 5% margin, half of the move is “close to a level”.
In addition, pullbacks in a trend tend to end in the central part of the move, which is exactly where 38.2%, 50% and 61.8% are concentrated. The price turning near one of them does not prove that the level caused the turn.
4. How to use them usefully
- As a zone, not a level. The band between 38.2% and 61.8% is a reasonable zone in which to expect a trend pullback to end. Within it, something else decides the entry: a confirming close, a smaller structure or your entry rule.
- With confluence. The zone becomes more interesting if it coincides with something independent: a previous high or low, a support or resistance zone or a moving average the price has already respected.
- As a warning when exceeded. A pullback that closes clearly beyond 78.6% is no longer a normal pullback; the trend is in doubt.
Fibonacci extensions (127.2%, 161.8%) are sometimes used to project targets. They have the same limitations: they are a reference, not an exact price. I explain how to project targets with other methods in Price Targets.
5. Harmonic patterns: too many degrees of freedom
Harmonic patterns combine several Fibonacci ratios into a single figure (Gartley, butterfly, crab…). Each author uses slightly different ratios and wide tolerance margins, so almost any sequence of highs and lows fits one of them. That is why I do not treat them as a tool in their own right: they have all the problems of retracements, multiplied.
6. In MT5
- Where it is: Insert → Objects → Fibonacci → Fibonacci Retracement.
- How to anchor it: in an uptrend, from the low to the high; in a downtrend, from the high to the low. Always with the same criterion of wicks or bodies.
- Levels: in the object’s properties, Levels tab, you can remove the ones you do not use. Fewer levels make the chart clearer and force you to choose.
To draw zones and levels quickly you can use SnapDraw, which only draws on the chart: it does not open or close trades or give signals.
Conclusion
- Fibonacci levels depend on where they are anchored. Set an anchoring rule and do not change it.
- They seem to work because they cover much of the move, especially the central part, where many pullbacks end naturally.
- Use them as a reference zone, between 38.2% and 61.8%, and look for confluence with independent levels before giving them weight.
In your next pullbacks, mark the 38.2–61.8% zone with a fixed anchoring rule and record where they actually end. Do it first on a demo account.
Want to bring this to your chart?
Jasopex tools for MetaTrader help you plan your risk before you trade.
See the tools