

Candlestick Patterns: Why One Candle Is Not a Signal
What a candle really tells you, why the same pattern means different things depending on where it appears, which patterns barely exist in 24-hour markets and how to check whether one works for you.
Hammers, engulfing patterns, dojis, morning stars… Candlestick patterns are the first thing almost every trader learns, and also one of the most common sources of unfounded entries. A candle summarises what happened in a given period, but on its own it does not say whether that behaviour will continue. This article explains what information a candle gives you, why context matters more than the pattern and how to check whether a pattern really works for you.
1. What a candle tells you
Each candle has four prices: open, high, low and close. The body shows the distance between open and close, and the wicks show how far the price went and where it came back from.
A long lower wick shows that the price fell and was rejected. But it does not say who rejected it or whether they will try again. In addition, the shape of a candle depends on two choices that have nothing to do with the market:
- The timeframe. The same market hours form different patterns on H1 and on H4.
- Server time. The daily candle starts and ends at the time the broker chooses, so two brokers can show different daily candles for the same day. I explain this in Market Sessions and Server Time in MT5.
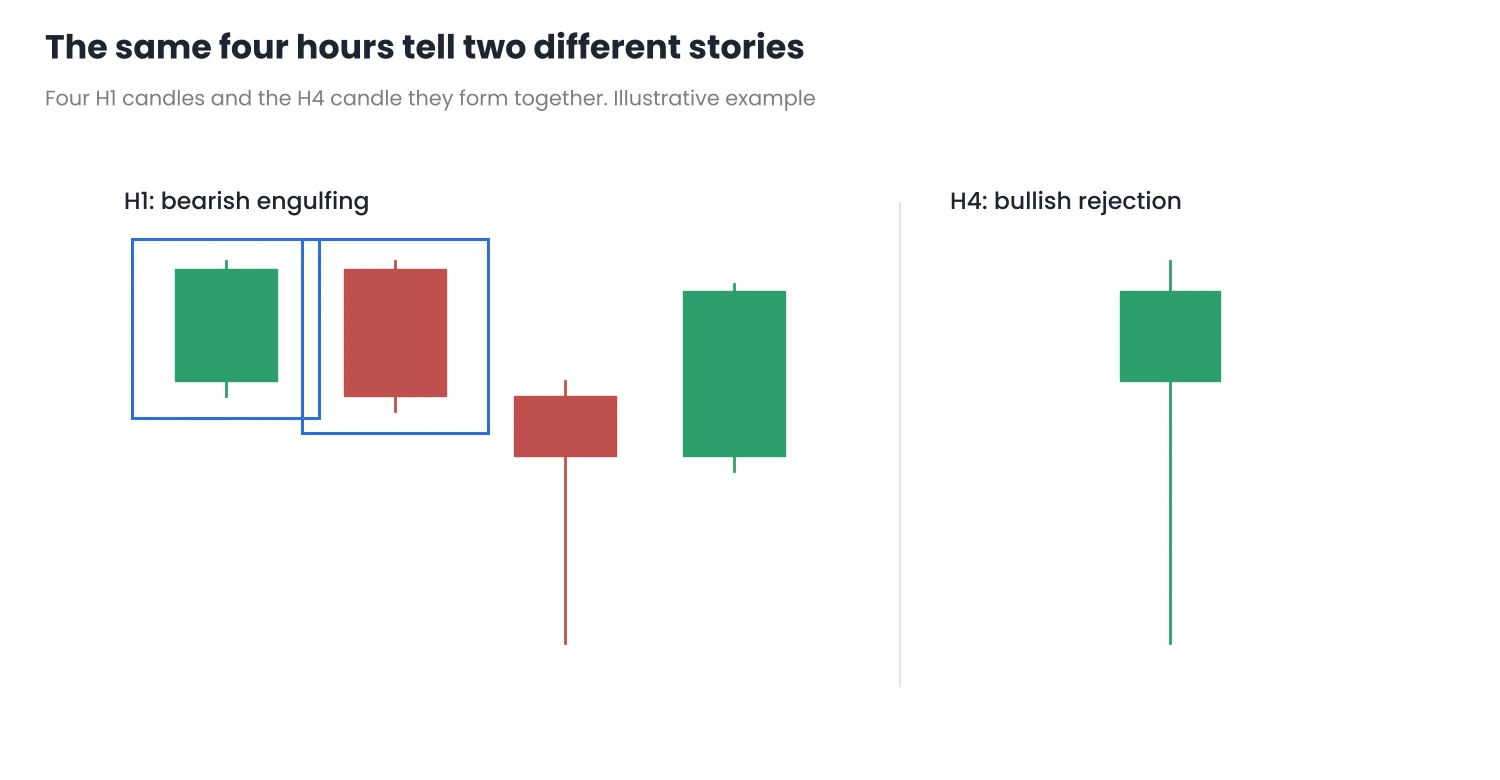
Figure 1. The same four hours: a bearish engulfing pattern on H1 and a bullish rejection candle on H4.
If the same stretch of price can be read as bearish on one timeframe and bullish on another, the pattern alone cannot be the signal.
2. The best-known patterns
| Pattern | What it shows | Where it makes most sense |
|---|---|---|
| Hammer / shooting star | A long wick at one end and a small body at the other: rejection of a level | After a clear move, at a relevant zone |
| Engulfing | A candle whose body covers the previous body in the opposite direction | At the end of a pullback within a trend |
| Doji | Open and close almost equal: indecision | Only as a warning; it needs confirmation |
| Inside bar | High and low within the previous candle’s range: contraction | Before a breakout, not as a direction |
General descriptions. Each author defines these patterns with slightly different criteria.
3. Why context decides
A hammer in the middle of a range, with no level nearby, describes an hour in which the price fell and came back. The same hammer after a decline, right at a support zone and with the next candle closing above its high, tells a much more complete story.
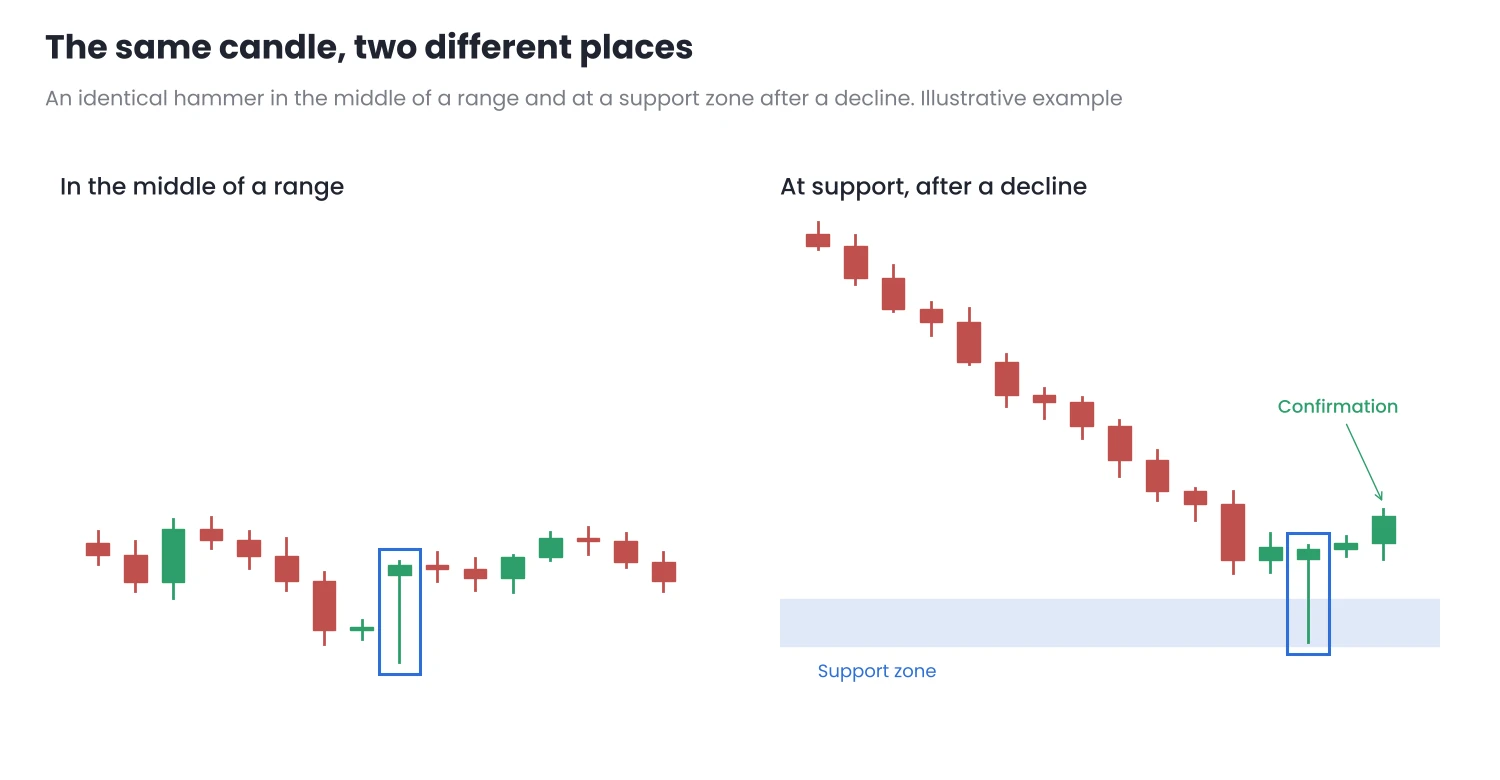
Figure 2. The candle is identical; what changes is where it appears.
Before giving weight to a pattern, it is worth checking four things:
- Where it appears. At a support or resistance zone, at the end of a move or on a pullback in the trend, not in the middle of nowhere.
- What it agrees with. A bullish pattern within an uptrend has more in its favour than one that goes against it. I explain how to define the trend in What Is a Trend?.
- What happens next. Waiting for the next candle to close beyond the pattern’s extreme reduces false entries, at the cost of a slightly worse entry.
- Volume, with caution. On CFDs, MT5 shows tick volume, which is not real volume. It can be a reference, but not proof.
4. Patterns that barely exist in 24-hour markets
Many classic patterns were defined in stock markets that close every night, where the next day’s open can be far from the previous close. Some of them, such as the “abandoned baby” or certain versions of the morning star, require a gap between candles.
In forex and many CFDs, which trade almost continuously, each candle opens practically where the previous one closed. Those gaps only appear at the Monday open or after a market break, so these patterns are very rare or need to be redefined. If a book presents them as common, it is probably referring to a different type of market.
5. How to check whether a pattern works for you
The only way to know whether a pattern adds anything is to define it with numbers and count what happens next:
- Define the pattern without ambiguity. For example: a lower wick at least twice the body, a close in the upper third of the candle and a low below the previous five candles.
- Add context as a condition. For example: it only counts if it appears at a zone marked in advance or in the direction of the higher-timeframe trend.
- Measure the result. Record how often the price reached a target before the stop. Do it by hand in your journal or code the rule in an EA and run it through the Strategy Tester.
- Compare with entering without the pattern. If entering at the same zone without waiting for the pattern gives a similar result, the pattern is not adding anything.
Conclusion
- A candle summarises a period; it does not predict the next one. Its shape depends on the timeframe and on server time.
- Context matters more than the pattern. Where it appears, which trend it agrees with and what the next candle does say more than its shape.
- Some classic patterns barely exist in 24-hour markets, because they depend on gaps between sessions.
Choose one or two patterns, define them with numbers and measure them in your history before basing entries on them. Test them first in the Strategy Tester or on a demo account.
Want to bring this to your chart?
Jasopex tools for MetaTrader help you plan your risk before you trade.
See the tools