

Overextension: When Price Is Too Far from Its Average
How to measure the distance between price and its average in multiples of ATR, why a very extended trend often pauses or pulls back, why that is not a sell signal and how to use it to avoid chasing the price.
We have all seen a price rise and rise and felt the urge to jump in “before it is too late”. Often that entry comes just as the move takes a breather, and the stop is hit on the first pullback. A simple way to avoid this is to measure how far the price has moved from its average. This article explains how to do it, what it usually indicates and why it should not be used as a signal in the opposite direction.
1. How to measure the distance
The distance between the price and a moving average, in points or as a percentage, is not comparable: 100 points is a lot on a quiet asset and little on a volatile one. To make the measure comparable, divide it by ATR:
Distance in ATR = (price − average) ÷ ATR
Example with a 20 EMA and a 14-period ATR on the daily chart:
| Asset A | Asset B | |
|---|---|---|
| Price | 20,400 | 1.1050 |
| EMA 20 | 20,100 | 1.0990 |
| Distance | 300 points | 60 pips |
| ATR (14) | 150 points | 60 pips |
| Distance in ATR | 2.0 | 1.0 |
Illustrative example.
Asset A is two ATRs from its average and asset B, one. Without ATR, comparing 300 points with 60 pips would say nothing.
2. What it usually indicates
When the price moves far from its average, the recent move has been fast and strong. Often what follows is a pause or a pullback towards the average before it continues, because those who entered earlier take profits and new buyers wait for better prices.
But “often” is not “always”. In strong trends, the price can stay extended for many candles, just as RSI can spend weeks overbought. I explain this in Overbought Doesn’t Mean Sell.
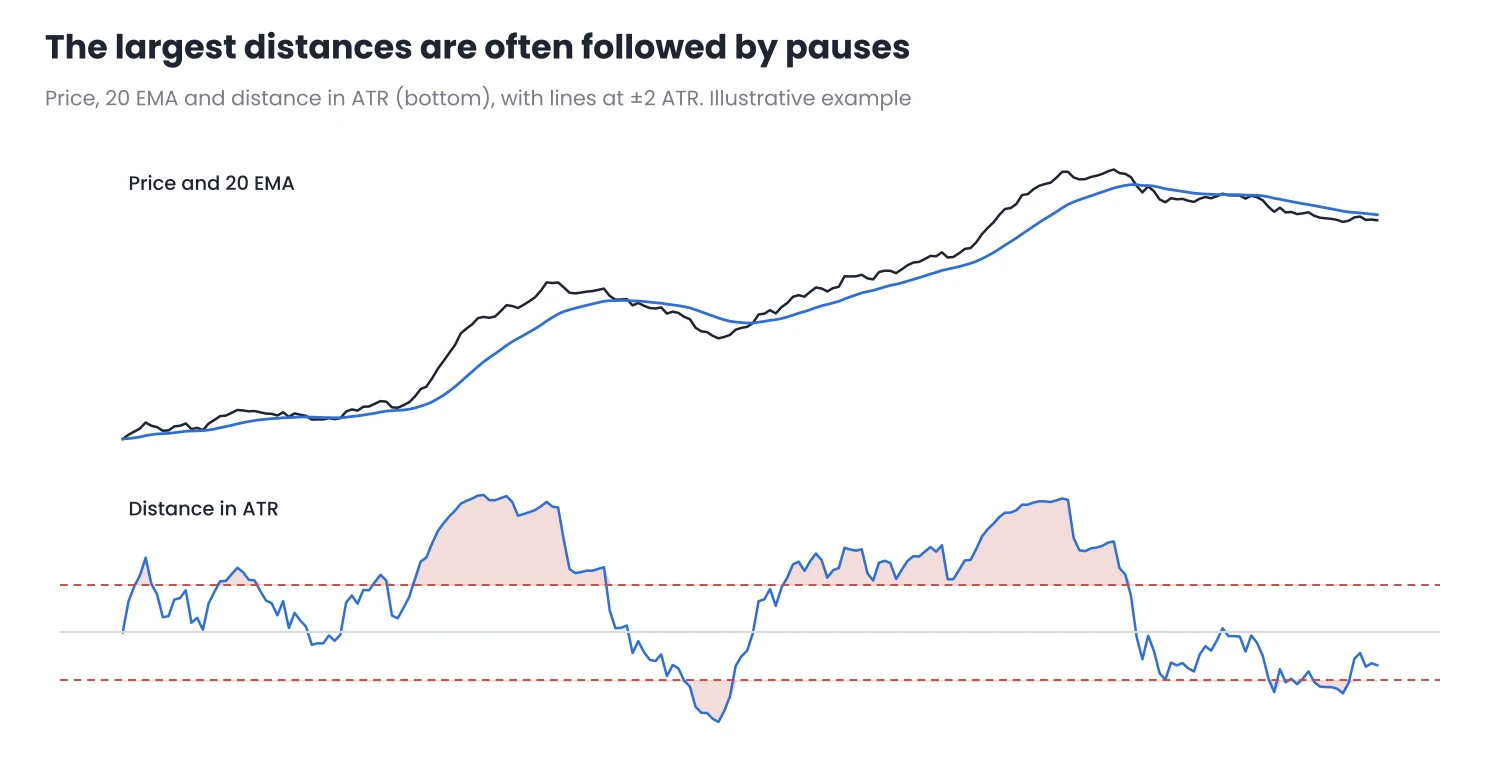
Figure 1. The largest distances are often followed by pauses or pullbacks, but not always by a reversal.
3. How to use it
Overextension is more useful for deciding what not to do than what to do:
- Do not chase the price. If the price is far from its average, a new entry has its stop far away or in mid-air. Waiting for it to come back towards the average gives an entry with a better risk-reward ratio.
- Do not sell just because it is far away. A large distance is not a contrarian signal. If your method trades with the trend, overextension is a reason to wait, not to turn around.
- Adjust how you manage what you already have. With a winning position open and the price very extended, it may make sense to switch to a closer structure-based stop, if your plan allows it. I explain this in Managing the Stop After Entry.
4. How much is “too much” for your asset
There is no universal threshold. The sensible approach is to measure it on your own asset and timeframe:
- Calculate the distance in ATR for every candle over a long period, for example two or three years.
- Look at how it is distributed. Most candles will be close to the average; few, very far.
- Choose a threshold beyond which you consider the price extended, for example the distance exceeded by only 10% of candles.
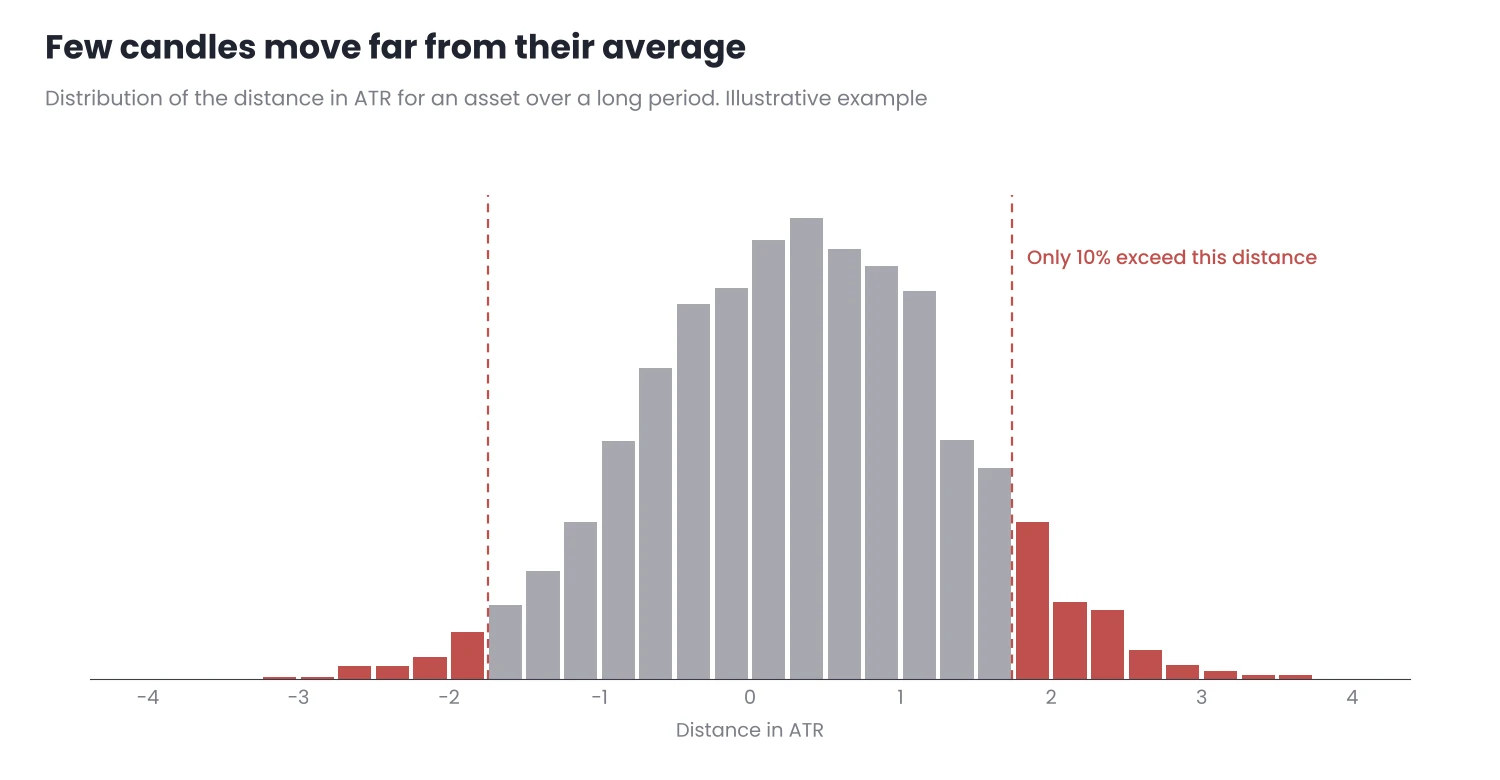
Figure 2. If only 10% of candles exceed a certain distance, that distance is your “extended” reference.
That threshold changes from one asset to another and from one timeframe to another. What matters is setting it with data, not by eye.
5. In MetaTrader
- There is no standard distance-in-ATR indicator, in either MT4 or MT5. You can calculate it by hand from the chart’s moving average and ATR, or use an indicator from the Code Base.
- Envelopes, available in both versions, draw bands at a fixed percentage from the average. They are a useful visual reference, but they do not adapt to volatility the way ATR does.
- ATR is in both: Insert → Indicators → Oscillators. If you use MT5, ATR Volatility Monitor shows the asset’s ATR in price and points and tells you whether volatility is high, normal or low. It does not open or close trades or give signals.
Conclusion
- Measure the distance from the average in ATR, not in points, so it is comparable across assets and periods.
- A large distance often precedes a pause or a pullback, but it is not a reversal signal: strong trends can stay extended.
- Use it to avoid chasing the price and to adjust management, with a threshold that comes from your own data.
Calculate the distance in ATR for your main asset over the last year and note from which value the price usually pauses. Do it first on a demo account before using it in your decisions.
Want to bring this to your chart?
Jasopex tools for MetaTrader help you plan your risk before you trade.
See the tools